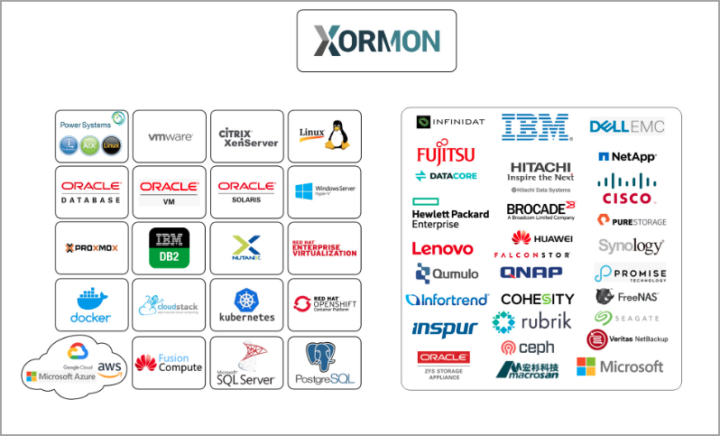
We have already talked about XorMon NG software, which is a consolidated 3-in-1 tool previously called STOR2RRD, that had during long period of time 3 different tools inside: XorMon Original, LPAR2RRD, and STOR2RRD. So the XorMon NG (Note: NG stands for New Generation) is useful to monitor your infrastructure. XorMon NG is a free, open-source software that supports VMware, Microsoft Hyper-V, Nutanix AHV, Oracle VM, and many other virtualization technologies. But note that here is also support for IBM Power systems.
It provides a complete performance and mapping overview through the cloud, server virtualization layer, database, SAN, LAN, and storage. One of the main benefits is to have a central solution for setting up your alerts and getting into the problem as quickly as possible and pinpointing the issue quickly via the interactive dashboards. You can use real-time, automated alerts for instant visibility into common issues within your virtual environment. In today's post will show you some cool SAN topology features as well as new way of working with interactive charts.
If you haven't read our articles about XorMon NG yet, here you can find the ones that are already available:
- Unleashing the Power of XorMon: A Deep Dive into the Latest Release
- Introducing XorMon NG 1.0 – The Next Generation of Infrastructure Monitoring
XorMon NG Architecture
A single virtual appliance to deploy within your environment. Once done, you can add your virtualization platform (VMware, Nutanix, Hyper-V), your physical servers, SAN, Storage Switches, SAN switches etc… There is also a possibility to install in Linux or run as Docker container. Those different installation options can be found here at Xorux web site.
XorMon NG provides a standard REST API for integration with other tools. Alerting and exporting is available for all devices, technologies and all their metrics.
Have you ever wanted to have single tool for monitoring and alerting? Download and try XorMON. For VMware it's an OVF file 2.2Gb in size, but on the download page you'll find downloads for other platforms (Linux, Docker, Hyper-V and other, agent OS downloads).
Xormon SAN Topology
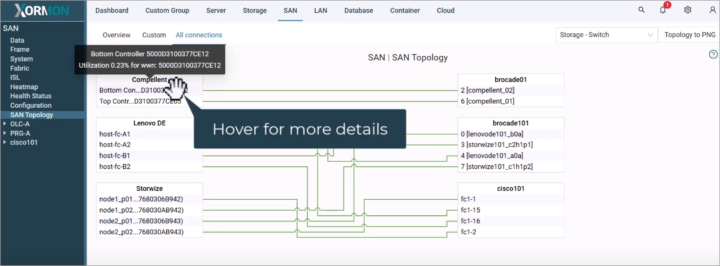
This feature within the software is to find details about your SAN topology, connections between the storage and SAN switches including the ports based on WWNs.
On the screenshot below, you can see that when you go to the Main menu > SAN > SAN Topology > All Connections, you can see all your connections between your storage and SAN switches. Once there you can hover over a device and get further details about current utilization (in %), and also details about the controller.
When you select the Overview, you get simplified view where you can select item to only highlight the connections for that particular item. As an example below, you can see the Lenovo storage conections to some Brocade and Cisco switches. See the screenshot below.
If you want to generate your custom view, you can do so on clicking the Custom sub-menu > Select your desired item > Apply. You'll only see part of the whole topology. This is particularly usefull when you have many storage devices and many switches within your enviornment so you can highlight only the part you are interested in.
If you want, you can check out the quick video where you will see all possibilities in actions. In this video you can see Topology for SAN switches and Storage systems as well. You can see connection based on ports or WWN.
Interactive Charts – New Graph Features
The new product has better charts and graph than the old one. In fact, the technologies has evolved over the years and Xorux has decided to give a major face lift tot the products line by creating XorMon NG and integrating new technologies to the front end and back end, as well as a microservice architecture.
- Frontend: JavaScript, React, Plotly.js
- Backend: Typescript, Node.JS, Nest.JS, Python, Perl, Unix shell
- Database: TimescaleDB
Many times people see those nice graphs, but does not know about the little gems that are built-in! Here we go to show you it all with some screenshots and very short videos.
Compare data on hover
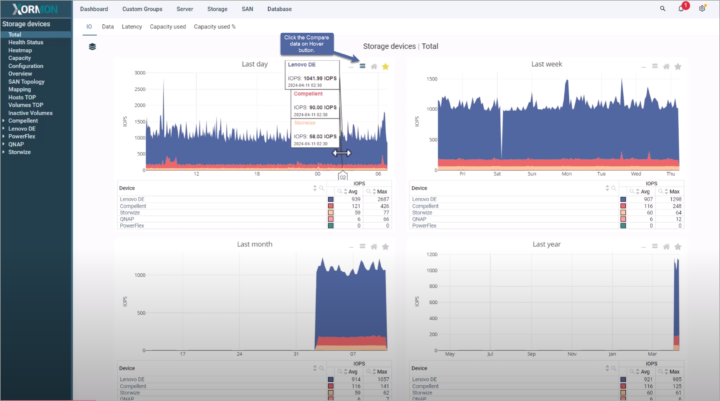
When using this feature within the charts, you click the Compare data on hover button and then hover over the chart. You'll see, as on the example below, the 3 different storage with IOPS compare stacked one on the top of the other. When you deselect the button Compare data on hover, you get back to the default view with only a single storage when hovering over. Pretty neat.
Select Required Timeframe
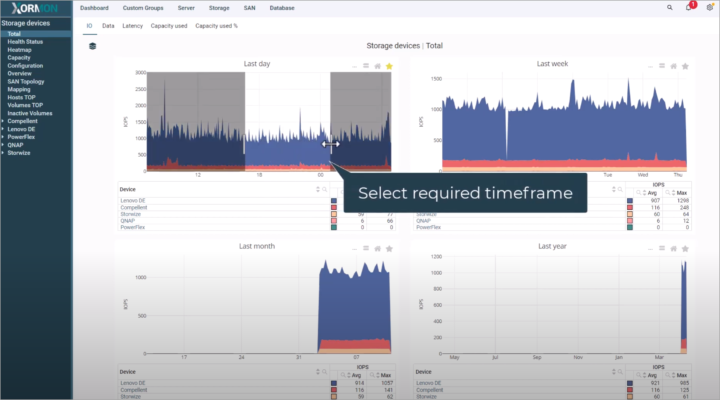
This is useful function that allows you to detail only the timeframe you need to visualize. (in case you see some spikes). Pretty straight forward. To reset back to default, just double click the screen.
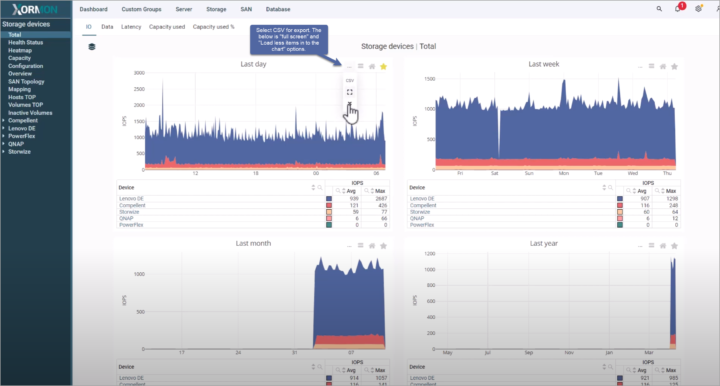
Export as CSV, Full Screen Chart and Load less items onto the graph
After selecting the required time frame, why not to export as CSV? You can do that by clicking the three dots > select export as CSV. Note that there are also other options (click on the image to see details).
Filtering Capabilities
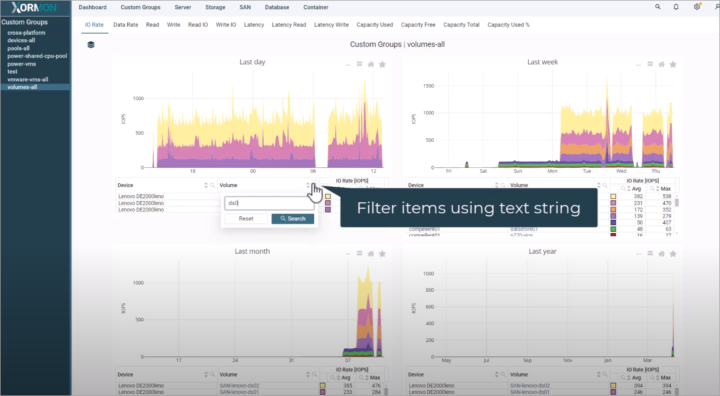
You can filter your graphs with a text string. Particularly useful when you see too many items on your screen. In the example below, we are in volumes-all > IO Rate. Here when we click next to the volume > enter search string to filter things out.
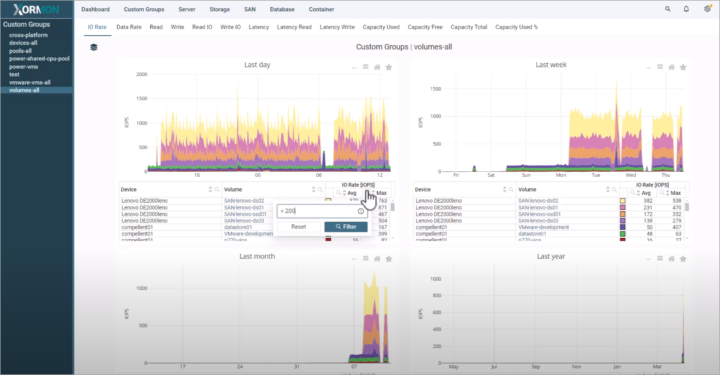
You can filter by Max value too where for example you only want to show storage using less than 200 IOPS.
The same process is for AVG value. Use “>” or “<” then click Filter button.
You'll see it all (and more) in the short video below. You'll also see other cool features that will make your experience better.
Final Words
Xorux has put a lot of effort into the development of the new product by consolidating those 3 older products. It is much easier to deploy and manage. Some parts are still in works, but for the most, it's done. As I said, the graphs are nice, but if you don't know how to get the most out of this, it is pretty shame. It only takes couple of min to read this post and watch two short videos to understand the value of the product as a whole. However, we have just uncovered small part of its possibilities as it it not possible to squeeze all features into a single article.
Upcoming posts will talk about Deployment, How to get started, Creating alarms (important as you can centralize your whole environment's alerts within a single product).
XorMon NG comes initially with a 2-month trial license, which is a lot, in the industry. After the trial’s expiration, the product continues to function as free edition with limited features. For those who wish to prolong the trial license, options are available through Xorux’s sales team. If you don't have time to deploy, you can still access the online demo at Xorux website where you can try those features I just talked in the above post.
More from Xorux
- Unleashing the Power of XorMon: A Deep Dive into the Latest Release
- Introducing XorMon NG 1.0 – The Next Generation of Infrastructure Monitoring
- Xormon NG – A great monitoring tool for virtualization admins
- Drill down for performance analytics and troubleshoot your storage, SAN and LAN switches with FREE Solution called STOR2RRD
More posts from ESX Virtualization:
- Two New VMware Certified Professional Certifications for VMware administrators: VCP-VVF and VCP-VCF
- Patching ESXi Without Reboot – ESXi Live Patch – Yes, since ESXi 8.0 U3
- Update ESXi Host to the latest ESXi 8.0U3b without vCenter
- Upgrade your VMware VCSA to the latest VCSA 8 U3b – latest security patches and bug fixes
- VMware vSphere 8.0 U2 Released – ESXi 8.0 U2 and VCSA 8.0 U2 How to update
- What’s the purpose of those 17 virtual hard disks within VMware vCenter Server Appliance (VCSA) 8.0?
- VMware vSphere 8 Update 2 New Upgrade Process for vCenter Server details
- VMware vSAN 8 Update 2 with many enhancements announced during VMware Explore
- What’s New in VMware Virtual Hardware v21 and vSphere 8 Update 2?
- Homelab v 8.0
- vSphere 8.0 Page
- ESXi 7.x to 8.x upgrade scenarios
- VMware vCenter Server 7.03 U3g – Download and patch
- Upgrade VMware ESXi to 7.0 U3 via command line
- VMware vCenter Server 7.0 U3e released – another maintenance release fixing vSphere with Tanzu
- What is The Difference between VMware vSphere, ESXi and vCenter
- How to Configure VMware High Availability (HA) Cluster
Stay tuned through RSS, and social media channels (Twitter, FB, YouTube)

