During VMware Explore 2023 in Barcelona, I went to see Xorux stand where I could chat and see a new demo of an upcoming product from Xorux. I have blogged about Xorux before, and you could certainly read my article Drill down for performance analytics and troubleshoot your storage, SAN and LAN switches with FREE Solution called STOR2RRD or LPAR2RRD – Free Monitoring Software Review.
On the other hand, Xormon NG is the upcoming product that will substitute for LPAR2RRD and STOR2RRD. It will join those two products into a unified, single pane of glass, an ultimate monitoring platform. Today we'll show you a video with a demo, with a couple of screenshots for better visibility.
When you think, virtualization is a powerful technology that allows you to run multiple servers, applications, and operating systems on a single physical machine. It can help you save costs, improve performance, and increase flexibility. However, virtualization also brings new challenges and complexities that require effective monitoring and troubleshooting tools. In case something goes wrong, it's not only a single system that may go down.
If you are looking for a comprehensive and easy-to-use solution for your virtualization environment, you should check out Xormon NG, the next generation of virtualization monitoring and troubleshooting from Xorux. Xormon NG is a free, open-source software that supports VMware, Microsoft Hyper-V, Nutanix AHV, Oracle VM, and many other virtualization technologies. It provides a complete performance and mapping overview through the cloud, server virtualization layer, database, SAN, LAN, and storage.
Video from VMware EXPLORE Barcelona 2023
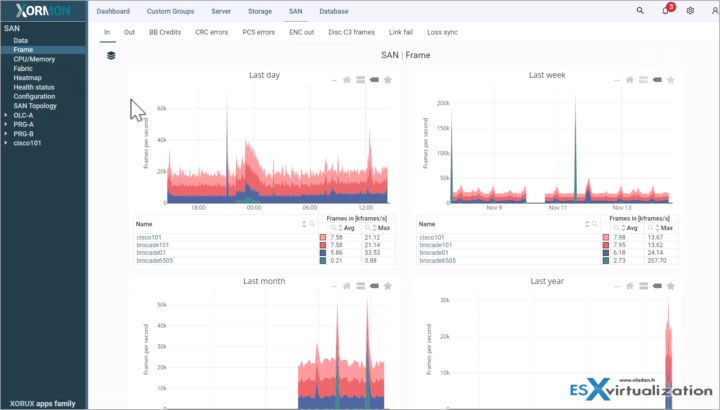
Screenshot from the UI (better quality than in the video).
Xormon NG Features
Automatically map dependencies between virtual objects, such as clusters, hosts, virtual machines, datastores, and networks. You can see the relationships and interactions among different components of your virtual infrastructure, and identify potential bottlenecks, failures, or misconfigurations.
Capture all performance data of your virtual machines, such as CPU, memory, disk, network, and application metrics. You can analyze the utilization, availability, and health of your virtual machines, and compare them with historical trends and baselines. You can also drill down into specific processes, services, and events running on your virtual machines, and troubleshoot issues with detailed diagnostics.
Support virtualization software from well-known vendors, such as VMware, Microsoft, Nutanix, Oracle, and more. But there is also support for IBM Power systems too. You can monitor and manage multiple virtualization platforms from a single dashboard, and get insights into the features and capabilities of each platform. You can also integrate with other Xorux products, such as LPAR2RRD and STOR2RRD, to extend your monitoring scope to physical servers, storage, and network devices.
The Xormon NG product will have its own Restfull API. You can use the Xormon NG RESTful API to integrate Xormon NG with other applications, such as dashboards, automation tools, or custom scripts. You can also use the Xormon NG RESTful API to perform various tasks, such as querying performance metrics, creating alerts, managing configurations, and more
Leverage a VM sprawl dashboard to stop the spread of inefficient resource usage. You can find and optimize over- or under-allocated resources for CPU and memory, and reclaim storage from idle and powered-off machines and snapshots. You can also track the growth and distribution of your virtual machines, and prevent performance degradation and waste of resources.
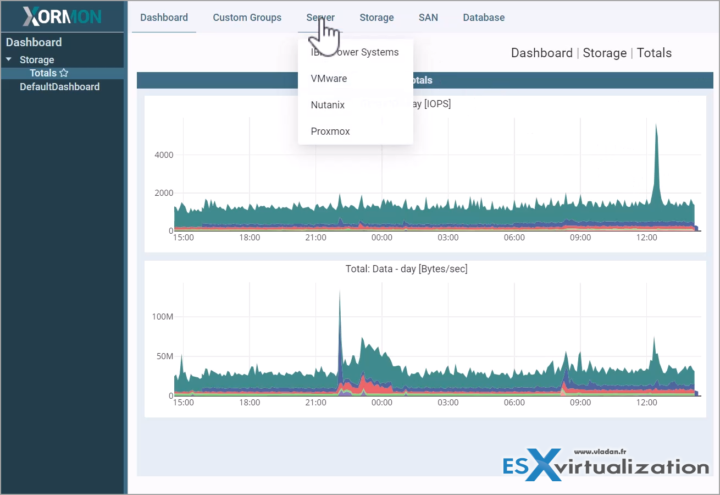
Screenshot from Xorux showing the different platforms.
Set alerts for faster VM troubleshooting. You can use real-time, automated alerts for instant visibility into common issues within your virtual environment. You can choose from many predefined alerts, or create your own custom alerts based on your specific needs and thresholds.
You can also receive notifications via email, SMS, or other methods, and take actions to resolve problems before they affect your users and business.
Xormon NG is the ultimate tool for virtualization monitoring and troubleshooting. It can help you gain full visibility and control over your virtual environment, and optimize its performance, reliability, and efficiency. You can download and use it as much as you want for free, or opt for paid support and enterprise edition which has even more features.
If you want to learn more about Xormon NG, you can visit the Xorux website, you can download their virtual appliance for a quick and easy installation or you can even try the online demo (login/password provided directly on the website).
More about Xorux on ESX Virtualization Blog
- Drill down for performance analytics and troubleshoot your storage, SAN and LAN switches with FREE Solution called STOR2RRD
- LPAR2RRD – Free Monitoring Software Review.
More posts from ESX Virtualization:
- VMware vSphere 8.0 U2 Released – ESXi 8.0 U2 and VCSA 8.0 U2 How to update (NEW)
- What’s the purpose of those 17 virtual hard disks within VMware vCenter Server Appliance (VCSA) 8.0?
- VMware vSphere 8 Update 2 New Upgrade Process for vCenter Server details
- VMware vSAN 8 Update 2 with many enhancements announced during VMware Explore
- What’s New in VMware Virtual Hardware v21 and vSphere 8 Update 2?
- Homelab v 8.0
- vSphere 8.0 Page
- Veeam Bare Metal Recovery Without using USB Stick (TIP)
- ESXi 7.x to 8.x upgrade scenarios
- A really FREE VPN that doesn’t suck
- Patch your ESXi 7.x again
- VMware vCenter Server 7.03 U3g – Download and patch
- Upgrade VMware ESXi to 7.0 U3 via command line
- VMware vCenter Server 7.0 U3e released – another maintenance release fixing vSphere with Tanzu
- What is The Difference between VMware vSphere, ESXi and vCenter
- How to Configure VMware High Availability (HA) Cluster
Stay tuned through RSS, and social media channels (Twitter, FB, YouTube)


