New feature present in Xangati's enhanced product detects Storms in the Clouds. VMware has entered the cloud business few years back, and Xangati with new release of Xangati can now help to detect a Storms in the Clouds via new feature called Xangati Storm Tracker.
Xangati has developed a way of detecting, recording and alerting those storms which can affect the end users. It's always the end user who is penalized when virtual infrastructure performing badly and experiencing a bottleneck. The end user accessing an application or network share which can became inaccessible.
The new feature is called Xangati Storm Tracker. What exactly it is and how it's presented in the Xangati's Dashboard? The StormTracker™ operates from within Xangati management dashboard in your datacenter (cloud) and indicates where a storm is located by dark color. The degree of darkness varies by degree of storm's severity.
Storm it means a bottleneck. A bottleneck can be a datastore which experiences high latency because of a VM which generates high IOps. It can be a network, storage adapter, which host CPU utilization. It's not always easy to find out where the storm is located and why it's happening. With Xangati you can, for example, drill down through the datastore which experiences the problems down to the VM, through a WMI (Windows VMs).
Xangati StormTracker UI is looking across your whole cloud. Storm Recordings showing areas of impact and why a storm is happening.
The cool thing is that the storm can be recorded from the end user's activity, you can see it from the end user's perspective. Xangati’s unique DVR like recording capability, on which I reported in my post here, is a unique feature which enables you to record automatically what’s happening automatically during a storm.
A quick quote from the press release:
StormTracker includes a new, robust, in-memory storm detection sub-engine integrated into Xangati’s flagship Performance Management Engine; and an interactive and contextual UI with multiple views into the entire cloud environment. In addition, Xangati has integrated performance management with capacity management to deliver essential insights to admins to ensure they don’t undersize the expansion of their cloud hardware infrastructure.
In-memory storm detection
– Automated pattern-matching heuristics
– Identifies storm cause and objects impacted
Click to enlarge.
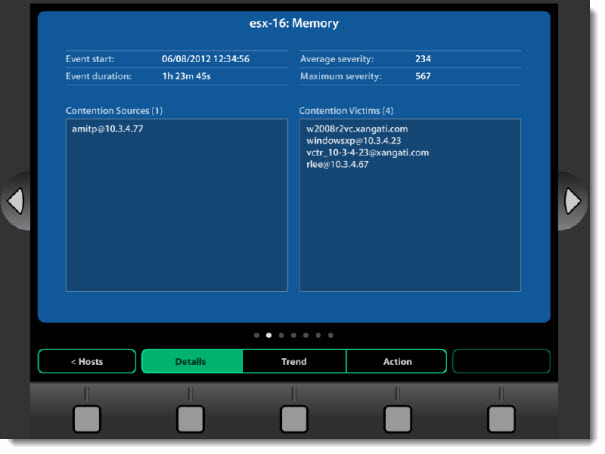
The darker areas can be right-clicked to explore further and dig deeper into a storm. On the image we can see a datastore contention, but why this is happening? This can be because of multiple reasons.
Some VMs generating some huge IOPS, or the datastore has got a contention problems.
The degree of darkness highlights severity. A storm areas can be shown across server, network and storage resources. You can zoom in/out to see all your hosts.
You can get comprehensive view into your cloud and have an instant view. The storms can be tracked over time, to see their severity and frequency. The recording of a storm can show which part of the virtual infrastructure has been impacted and why. With linking deeper to an object level, it's possible to view the recording for the impacted object. A remediation recommendations are provided.
“Assuring performance in a cloud environment requires a new approach backed by next generation architecture,” said Alan Robin, CEO of Xangati. “Only Xangati with StormTracker is tackling the critical problem of performance storms impacting the evolution to the cloud. Our solution which is based on a novel in-memory computing architecture, continuously tracks all data center objects and their cross-silo interactions combing large scale clouds for storm patterns. Competing solutions are based on inherently sluggish database driven architectures which enable transient performance storms to fly under-the-radar and lead to devastating consequences in the data center.”
“Traditional alert monitoring solutions were designed to focus on shifts in individual metrics in a pre-cloud data center environment,” said Zeus Kerravala, founder and principal analyst with ZK Research. “My research shows that admins are uncomfortable with this model, given how the data center has evolved—investigating alerts is akin to chasing one’s tail. By tracking storm fronts and their source, Xangati empowers IT to always understand how their cloud is behaving and to instantly identify emerging storms—saving valuable time and resources, while allowing them to anticipate and avoid future storms.”
Many performance storms are tied to resources contention. Understanding the resources contention can help admins to detect problems and avoid them.
Xangati StormTracker injects storm analysis into its capacity trending algorithms.
Pricing and licensing
The new update is a free upgrade for existing customers, and it's a part of Xangati Management Dashboard and Xangati for vSphere (Free version). Xangati’s StormTracker technology is available and is included in the purchase price of one of the solutions within the Xangati XMD suite – Xangati VI Dashboard at $150 per socket; and Xangati VDI Dashboard at $10 per desktop. At that time, Xangati will also make the offering available via download as a free two-week trial.
Xangati for vSphere—Free will also still be made available and include all of the new StormTracker functionality for a single vSphere host.
Source: Xangati
More from ESX Virtualization:
Stay tuned through RSS, and social media channels (Twitter, FB, YouTube)


