An interesting network product called WhatsUp Gold took my attention recently. It's built by admins for admins. When you read the latest release notes, you can see that many new features have been developed and integrated because of admins' feature requests.
WhatsUp Gold allows you to discover all your network's active devices, analyze them, monitor for downtime, and find problem areas that need more attention. It allows you to proactive monitor, from a single UI, your on-prem or cloud environments, whether they are physical or virtual.
You can continuously monitor the availability and performance of your infrastructure, 24/7. The system can monitor routers, switches, firewalls, servers, storage devices, applications, desktops, or virtual machines (VMs).
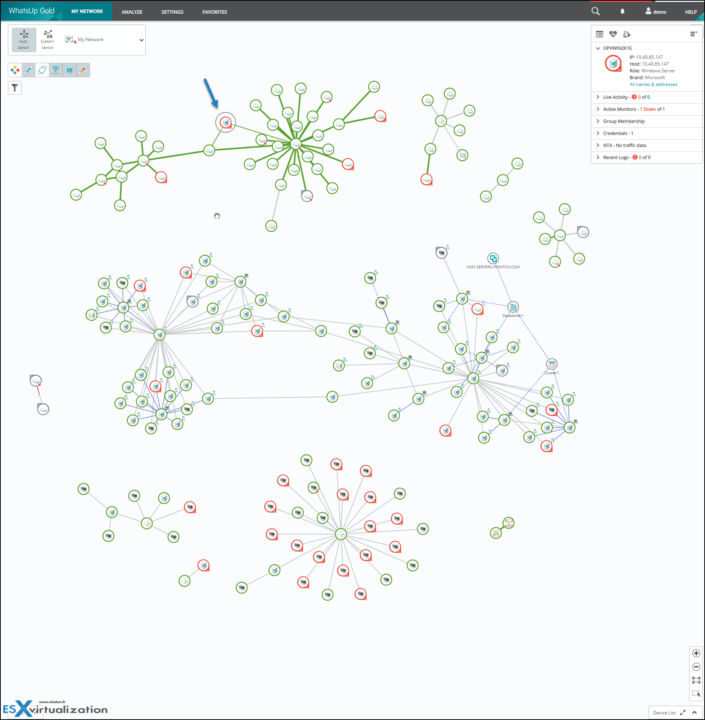
Your whole environment, including the dependencies, is discovered automatically within the initial scan which takes a couple of mins. After the initial scan, an interactive map is created. On the map, every device is represented with its status, online/offline/ etc. You'll be able to see your wireless, virtual, or cloud resources within this map and troubleshoot problems in connectivity or performance.
WhatsUp Gold can also track Amazon AWS or Microsoft Azure usage and billing so you can follow whether the costs are on the rise. It can generate reports to justify expenditures too.
Application monitoring is also possible because the system supports some of the most popular ones such as Outlook 365, Sharepoint or Exchange or SQL Server.
You can set monitoring, filtering, and search with alerts on logs for every device within your environment. WhatsUp Gold can also track log volume changes saving you perhaps some nightmares when some large-size generated logs fill completely your hard drive giving no room for your applications to run.
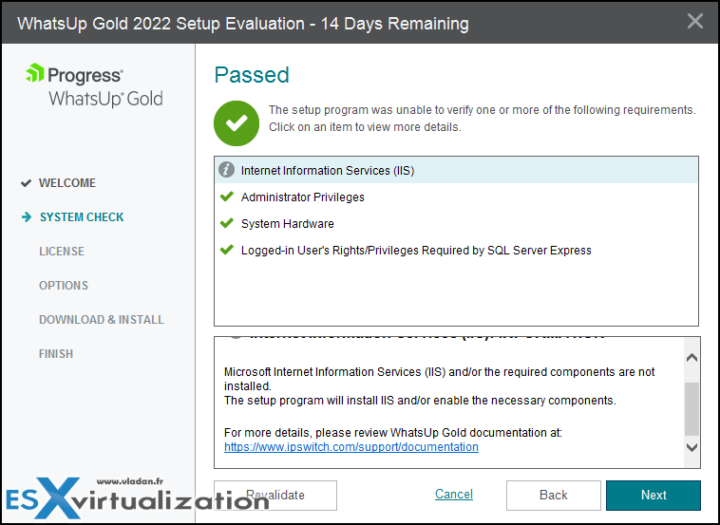
The system installs a SQL server instance and needs Microsoft IIS as a pre-requisite. I quickly tested the installation on Windows Server 2022. If the IIS isn't present on the machine, the installer will take care of it during the installation.
A 14-day fully functioning unrestricted Free Trial: https://www.whatsupgold.com/trial
Interactive demo: https://www.whatsupgold.com/interactive-demo
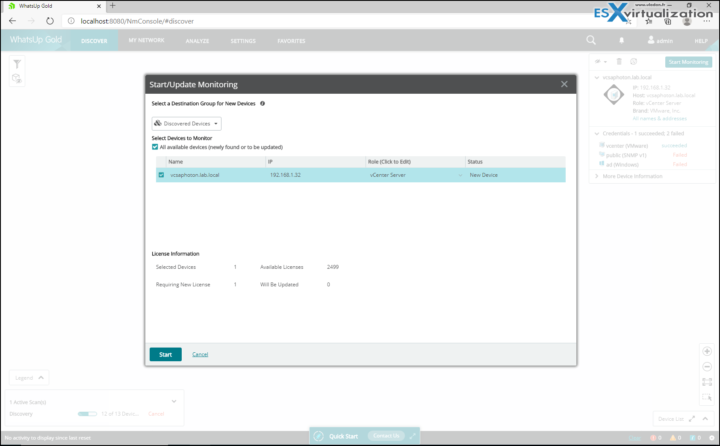
In order to add vCenter server, you must provide credentials before the initial scan. The same applies to Windows/Linux devices otherwise WhatsUP Gold is able to monitor UP/Down states only. Please click to enlarge…
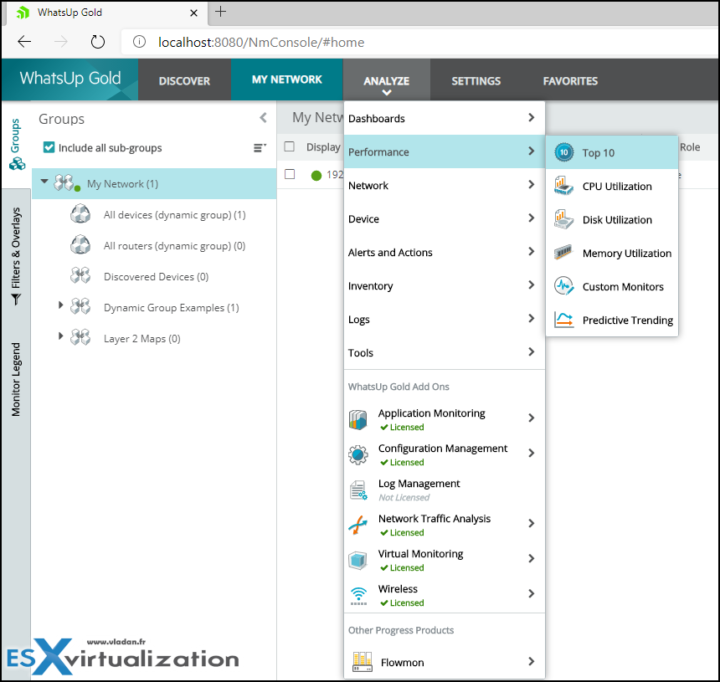
Once you added your credentials and scanned your network, you have access to the dashboards, analyze the performance of the network, devices, set alerts etc…. Here is a screenshot from the menu-driven dashboard whcih is web-based.
I have browsed the website where you can connect to an interractive demo environment which is better than a lab with 3-4 devices only, and you can see that some of the dashboards are pretty slick. You can monitor pretty much everything.
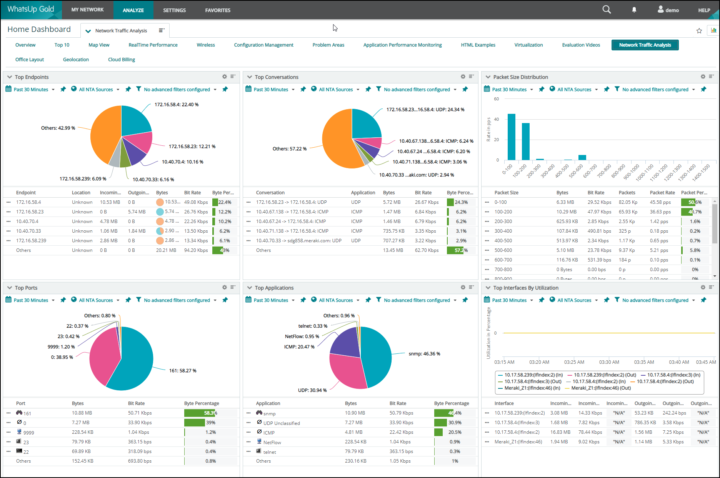
Example of network traffic analysis below shows the top endopints with the most traffic during the past 30 min, the packet size, top ports which are used within your environment, top applications or top users that are using the most network bandwidth.
And here is another screenshot which shows the interractive map that is generated once your environment is discovered. The colors are telling. The red circle which I clieked is a Windows server that is curently down…..
The green links are active links, but if problems, the green turns red as you imagine.
Click tthe photo to enlarge…
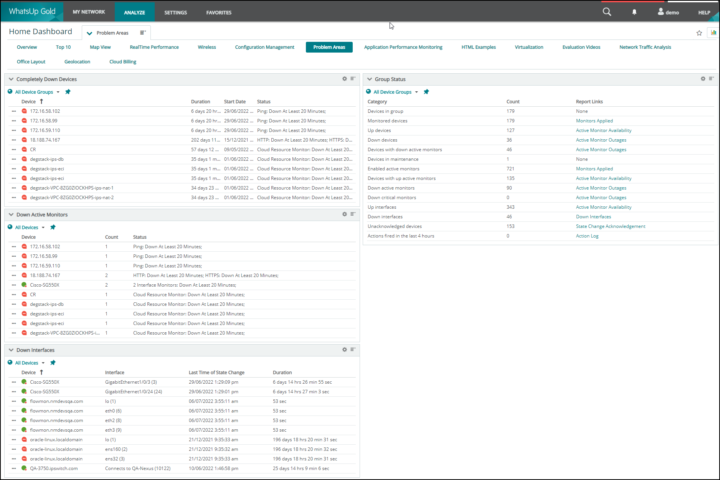
Another dashboard called “Problem Areas” signals the devices which are offline for at least 20 minutes. ou can see the devices there, and since when they're offline. You can also see which devices with their interfaces are down. It's possible to create custom groups for better categorization.
WhatsUP Gold Features
- Automated Discovery – Layer 2/3 discovery which can be initiated from an IP Range Scan or SNMP Smart Scan of a core router’s Bridge Table
- Application Monitoring – availability and performance of mission-critical applications like Exchange, SharePoint, Dynamics, Lync, SQL Server, DNS, Internet Information Services (IIS), Active Directory, Hyper-V and more
- Bandwidth monitoring – You can do a real-time bandwidth monitoring. Setup and apply QoS policies. WhatsUp Gold verifies Quality of Service over through Type of Service (QoS over ToS); DSCP for LAN/WAN, CBQoS policies and Cisco NBAR classification mechanisms.
- Cost cloud monitoring – If you have unused or under-used cloud resources that you’re still paying for, those can be found through detailed performance reports. It allows you to understand what you’re using and when makes it easy to optimize your cloud resources and lower your costs.
- Configuration mangement – Automate configuration and change management for routers, switches and firewalls on your network, Archive and audit network configurations, Get alerted to changes. (depends on licensing edition).
- Distributed monitoring – when you have multiple remote networks, you can have a central installation and one or more remote installations. A single instance of WhatsUp Gold is determined to be either the central site or a remote site in a distributed environment.
- Failover Manager – allows you to failover to standby system (if configured).
- Flowmon NPMD/NDR (new) – View details about your traffic analysis through the same interface you use to monitor your infrastructure. This allows you to use fewer tools, better MTTR, more efficiency, better/faster diagnosis, etc.
- Log Management – You can monitor, filter, search and alert on logs for every device in your network. Watch for trends like log volume changes. You can also filter and archive logs to any storage locations for any retention period and be able to comply with regulatory requirements and preserve historical data.
- MSP monitoring – Able to monitor both on-premises and cloud deployments from the same console, for different tenants.
- Network mapping – discovery and mapping tool combines Layer 2 and Layer 3 discovery methods to create comprehensive, interactive network maps that are easily customized.
- Server monitoring – agentless polling techniques via SNMP and WMI
- Traffic monitoring – Make sure that your business-critical applications are getting enough bandwidth. You can monitor network traffic, receive alerts, see reports. WhatsUp Gold allows you to drill-down and identify the sources and destinations of your internet traffic, the applications consuming internet bandwidth, and the users of those applications.
- Virtualization management – Monitor the performance and resource consumption of hosts and guests, including CPU, Memory, Disk and Interface Utilization
- Wireless monitoring – You can track who’s on your wireless network, where the users are connected and how much bandwidth they’re using. You want to monitor suspicious activities on your wireless network.
- REST API – The API is exposed through Swagger. It allows you to manipulate WhatsUp Gold from 3rd-party applications like SalesForce, MS Office 365 and others. Automate your tasks. Extract network monitoring data for use in other systems or let them make changes to WhatsUp Gold.
Interactive demo: https://www.whatsupgold.com/interactive-demo
14 day fully functioning unrestricted Free Trial: https://www.whatsupgold.com/trial
WhatsUP Gold Licensing
There is a FREE version of WhatsUP Gold now and provides twenty (20) points of key WhatsUp Gold features at no cost and with no obligation. Other than that, there is a PREMIUM subscribtion-only license, or PREMIUM perpetual. Other than those, there is a TOTAL PLUS that has everything and then there are Bundles or Distributed monitoring editions or Device-Based licensing options too. A way too many to explain within a single blog post. Check licensing page here.
Wrap up
To me, WhatsUP Gold looks perfect for monitoring a company's network without really being a network engineer. An average network admin will find it more than enough to be alerted when a server, desktop, switch or storage is down or when users complaining about “network is slow today” situations.
WhatsUP Gold is able to track devices connected to your network, with alerts when there is a downtime or performance issues. It improve compliance and risk management as well as improve business process agility.
It is a 24/7 monitoring solution with real times alerts and ability to set up multiple alarms on different systems. It may not looks too easy to setup and configure the first time so when looking for installing system like this, you will possibly need to learn a bit from the documentation first about all possibilities and installation options (there are quite a few) before jumping in and running the installer.
The interface is clean, with the depth of detail collected and accessible. It allows us to visualize your network and make decisions when troubleshooting or examining performance related issues. You can schedule reports and collect log data. It is a useful tool for IT and virtualization/cloud administrators. The cloud cost volue is a big plus to me as it allows to track cloud cost growing on a daily basis.
More posts from ESX Virtualization:
- VMware vCenter Server 7.0 U3e released – another maintenance release fixing vSphere with Tanzu
- VMware vCenter Converter Discontinued – what’s your options?
- How to upgrade VMware VCSA 7 Offline via patch ISO
- vSphere 7.0 U3C Released
- vSphere 7.0 Page[All details about vSphere and related products here]
- VMware vSphere 7.0 Announced – vCenter Server Details
- VMware vSphere 7.0 DRS Improvements – What's New
- How to Patch vCenter Server Appliance (VCSA) – [Guide]
- What is The Difference between VMware vSphere, ESXi and vCenter
- How to Configure VMware High Availability (HA) Cluster
Stay tuned through RSS, and social media channels (Twitter, FB, YouTube)

