VMware Tools heartbeat is used by vSphere High Availability (HA) checking if VM is in running state.
You must first enable it at the cluster level. There is a choice of disabling, enabling for VMs or enabling for VMs and Applications.
The VMware tools heartbeat is sent to host and if host does not receive those heartbeats within a certain period, the VM is restarted.
What's monitored through VM tools?
- I/O activity
- Guest OS heartbeat.
If there are no VMware tools heartbeats received then vMotioning VM which guest OS isn't sending those heartbeats will show a warning saying that:
Migration from source_server: No guest OS heartbeats are being received. Either the guest OS is not responding or VMware tools is not configured properly.
Trying to restart VM tools should fix that, or, if this warning appears after a vCenter service being restarted you might have to restart management agent on an ESXi host as precised in this VMware KB.
I also stumbled on few things in the vSphere documentation page.
When you enable VM Monitoring, the VM Monitoring service (using VMware Tools) evaluates whether each virtual machine in the cluster is running by checking for regular heartbeats and I/O activity from the VMware Tools process running inside the guest. If no heartbeats or I/O activity are received, this is most likely because the guest operating system has failed or VMware Tools is not being allocated any time to complete tasks. In such a case, the VM Monitoring service determines that the virtual machine has failed and the virtual machine is rebooted to restore service.
This means that there are not one but two factors taken into account – I/O activity and Guest OS heartbeat.
Where to setup Cluster Wide option for VM and Application monitoring?
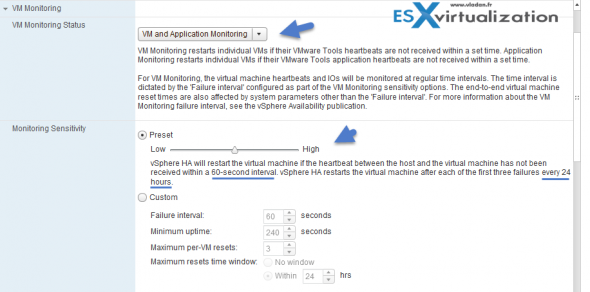
In VMware vSphere cluster it is possible to configure the VM and Application monitoring, by going and selecting:
Select cluster > Manage TAB > Settings > Click Button Edit
VM Monitoring Sensitivity in HA Cluster:
And the settings can be adjusted to the “High” or “Low” values. This changes the text on the page and obviously also the behavior…
Here are the examples from the vSphere Web Client:
Overriding the cluster automation level for a VM
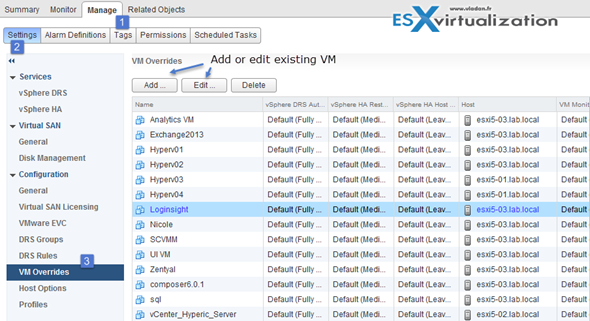
It's possible to override the cluster wide settings for some VMs needing to have different settings. You can do that by staying at the same level where you are, it meas at:
Select cluster > manage TAB > Settings > VM Overrides
So you can see that it's possible to easy set an automation level (at the cluster level) than is also simple to set an automation level that is different from the DRS cluster automation level.
It's a Per-VM basis. Individual VMs can be adjusted to the requirements each of those VMs needs. The cluster settings are overridden by setting those VM overrides.
No Application monitoring without SDK?
I found at the VMware documentation (p8.), an SDK is needed to enable application monitoring for specific application:
To enable Application Monitoring, you must first obtain the appropriate SDK (or be using an application that supports VMware Application Monitoring) and use it to set up customized heartbeats for the applications you want to monitor. After you have done this, Application Monitoring works much the same way that VM Monitoring does. If the heartbeats for an application are not received for a specified time, its virtual machine is restarted.
The default monitoring in the Guest OS can be expanded further via Application HA and vCenter Hyperic product which with the help of special agents installed inside of each of the monitored VMs can trigger the application restart. In such a case not the whole VM is restarted, but only the monitored application which failed.
It's also possible to monitor Applications through LogInsight product (with help of Microsoft Content Pack) which in it's latest version can monitor Windows and Linux VMs through a small, lightweight agents. The Microsoft Windows Operating System Log Insight content pack provides actionable data, for Windows OS operations managers, specifically for troubleshooting and pinpointing problems. The latest version of LogInsight product was announced during VMworld 2014.


I/O Activity monitoring is an additional validation mechanism to avoid false positive alerts based on I/O stats interval.
If no more heartbeats are received within the failure interval, the I/O stats interval is checked. The I/O stats interval determines if any disk AND network activity have occurred for the virtual machine during the previous two minutes by default. If not, the virtual machine is reset. This default value (120 seconds) can be changed using the advanced attribute das.iostatsinterval.
Good stuff. The I/O stats are checking 2 things: Disk and Network activity…. You nailed it Didier…
Why doesn’t initiate vm monitoring (vm monitoring only is enabled) a ha failover in case of a host (in ha cluster) with apd? The vm is still running but the guest os, eg. Windows is no longer functioning correct. vCenter still displays that the VMware tools are running. While the vm is in a failure state I’m still able to ping the vm. I would think that VMware tools is no longer able to send a heartbeat to the hostd that a ha failover should be occur. I can’t find an answer that clarifies this behavior. Can you explain this this behavior?