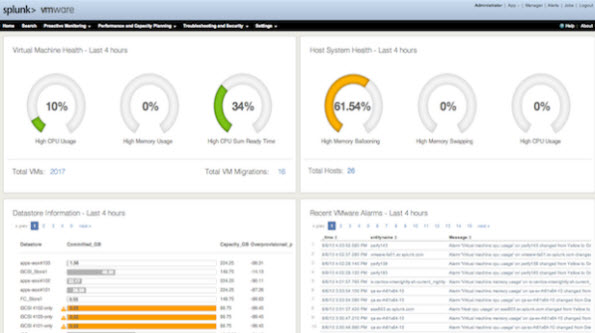
Splunk App for VMware version 3.0 has been released and introduces different architecture for the data collection and also a new GUI based configuration which makes the configuration process easier.
The Splunk App for VMware 3.0 reduced the amount of data which is pulled from vCenter and ESXi hosts. (ex. vCenter daily logs = 15Mb; ESXi logs = 135-235Mb; Host performance data = 10 Mb; VM performance data = 3 Mb per day).
Also, the logs from ESXi are now in syslog format, so it's possible to dig a quick query to get the result in syslog format to be sent quickly to VMware support for example.
The product is bundled as an OVA file which is easily deployed to vCenter. The application is available as 90 days trial from Splunk.
Quote from the release:
This version has introduced the concept of a Data Collection Node (DCN), which replaces the virtual appliance from 2.0. The DCN collects performance metrics, tasks and events, inventory, hierarchy and topology information – all from VC.
Compatibility with:
- vSphere versions 4.1, 5.0, 5.0 Update 1 and 5.1.
All Features of Splunk for VMware 3.0:
- A data collection engine, written in python, that makes calls to the VMware API.
- Data collection directly from vCenter. We no longer make direct calls to ESXi hosts.
- ESXi log data collection directly from the ESXi hosts using Syslog.
- A user interface driven data collection configuration process that has simplified the installation and configuration of the app.
- A scheduler that manages the distribution of data collection jobs to data collection nodes (previously the Forwarder Appliance Virtual Machine). The scheduler can be configured from a single configuration dashboard and implements fault tolerance and load balances data collection across nodes.
- Pre-built views showing tasks associated with hosts and events associated with data health, inventory views where you can monitor the components of your VMware environment, and performance views where you can monitor the performance of your hosts and virtual machines.
- Default thresholds set for the VMware performance metrics collected by the app. The default number collected is approximately 24. You can easily configure the thresholds in the app to work for your specific environment or you can manually edit the
sa_threshold.conffile.
Links:
- Documentation
- Release notes
- Splunk for Vmware Installation and Configuration Guide
Source: Splunk Blog

