There is a new whitepaper provide by VMware which teaches you how to monitor VMware VSAN with a VMware VSAN Observer. It's a utility which is baked in with vCenter server (since 5.5 U1) and which allows to dig deep into VSAN's performance, see the IOPS, latency, Outstanding I/Os and congestions etc…
It's quite complex tool when you first start it. Even for starting it up, you must know how to do it (see my how-to) as it's part Ruby vSphere Console (RVC). The RVC console wasn't public from the start. The tool was used exclusively by VMware VSAN development team before it was released to public.
I have setup VSAN observer and took a first look at it, like how to start the tool and see the dashboard, but the author – Rawlinson Rivera (in collaboration with Christian Dickmann, Mousumi Millick, Joe Cook and Charu Chaubal) goes much deeper and shows for example 3 different modes you can start VSAN observer in:
- Live monitoring for a Virtual SAN cluster
- Offline Monitoring
- Full Raw stats bundle
The paper is destined to VMware administrators leveraging VSAN in their environments. The paper is a real good resource.
I'm going to use myself to see how my own homelab VSAN installation performs.
The PDF is 44 pages long. You'll learn about many things. For example:
- IOPS
- Outstanding IOs
- Latency
- Bandwidth
- Congestion
- Virtual SAN Architecture
There are good explications to start with:
IOPS gives a measure of number of Input/Output Operations Per Second of a storage system. An I/O operation is typically a read or a write and a size. I/O size can vary from anywhere between a few bytes and several megabytes.
And here:
Outstanding I/O – When a virtual machine requests for certain IO to be performed (reads or writes), these requests are sent to storage devices. Until these requests are complete they are termed outstanding I/Os.
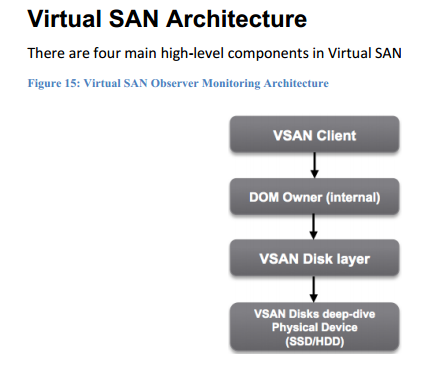
The paper is full of graphics. This one is just general VSAN observer graphic, but many screenshots from the UI details every menu item so you can really master the tool.

As said, the paper treats every menu of the VSAN observer tool:
- VSAN Client
- VSAN Disks
- VSAN Disks (deep dive)
- PCPU
- Memory
- Distribution
- DOM Owner
- VMs
- About
The paper also provides 4 examples of workflows and each example then explains with screenshots where to look and how-to read the performance metrics! This is very valuable.
You can download this paper from this post. Enjoy…

Hello Vdlan,
I saw ur post on Vmware virtual san observer here.
I am trying to connect to my windows based vcenter server(running vsan cluster) from a secondary vcenter server appliance, that has been created dedicatedly for this purpose. I run the vsan.observer command using that, the command keeps running and loads infor. for 2 hours, but nothing comes up if I try to connect to 8010 port on the vcenter server.
I read in a post that it might be due to nokogiri -v 1.5.6. My vcenter server is on windows server 2008 R2 datacenter(http://vinfrastructure.it/2014/05/vmware-virtual-san-observer/)
When I try running this command directly on vcenter server by navigating to the rvc folder in programfiles amd running the RVC command, I am unable to navigate to the Cluster, I get this error: RuntimeError: unknown VMODL type AnyType
Now I just upgraded my vcenter server to 5.5 U1b from 5.5 U 1a, still the issue persists and even after successful start of the webserver, nothing comes up on 8010 port. It is mentioned in release notes of 5.5 U1b that this issue for unable to navigate has been fixed in this release.
I would be highly obliged for your help and patience. Please help me.
regards,
Rizul Khanna([email protected], India)