Today we write about another Czech company called Xorux and their Free performance monitoring software for VMware and IBM Power Systems. Their product's name is LPAR2RRD. The same virtual appliance for VMware has a second product built-in called STOR2RRD which does performance monitoring for enterprise storage systems of almost all vendors
They do not sell the product software license as the product is distributed and released as a freeware under GNU General Public License. The paid support entitles you for more available features within the product as well as a support, which allows not only being supported in case of a problem but allows things such as a creation of personalized reports or ingestion of data coming from your environment and feeding them into otherwise incompatible chargeback systems. Things really useful for organizations such as service providers or large customers.
Before we jump into the installation, I'd like to say few words about the look and feel and also what to expect. The product is agentless, but you can, in some cases use an agent, which pulls more details from the system. The dashboard is traditional HTML and Javascript, no flash. It's fast and responsive, and if you don't like fancy animations and you're kind of old school, you'll like it.
The details pulled out are from vCenter server, but you can also hook up individual (unmanaged) ESXi hosts and, attached datastores. With that said, let's jump into the installation.
The installation and configuration of LPAR2RRD
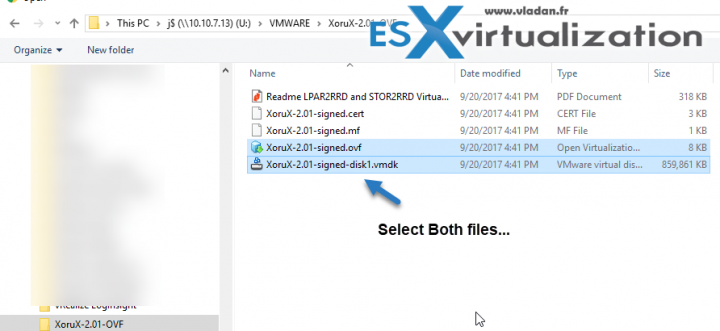
For VMware vSphere or individual ESXi hosts, you can download pre-configured virtual appliance from this link. Note that they also support Hyper-V, Docker, Linux as systems. As being said, the virtual appliance bundled as OVF files (1 config file and 1 VMDK), but before we walk you through the deployment, we must make sure that we have an account on our vCenter server (with read-only privileges) for this tool to operate. So let's first meet this requirement.
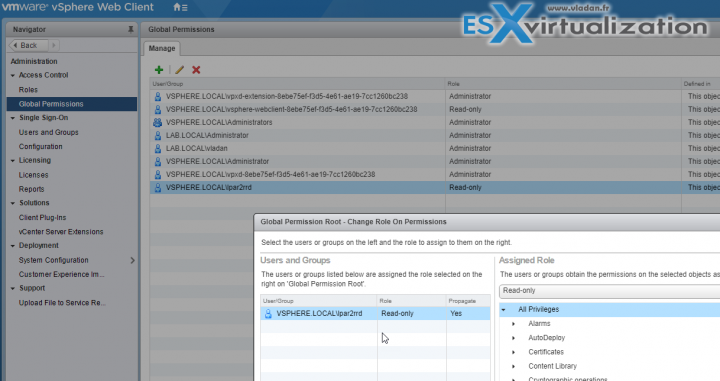
Step 0: Create a user within your vSphere environment and assign a read-only role. Very simple. Login via vSphere client > Administration > Users and Groups > Add. You create lpar2rrd user there.
Then, go to Global Permission > Select the lpar2rrd user you just created and assign Read-Only permission.
Step 1: Home > VMs > Actions > Deploy OVF template > Browse > Navigate and select both files (the OVF and VMDK) and follow the assistant. I don't think we need to details those steps.
Step 2: Power On the VM and wait until the VM picks up an IP address provided via your DHCP server. You can always change the DHCP into the Fixed IP, but for our test, we just stick with DHCP.
You can then login into the web interface http://ip_of_your_appliance/lpar2rrd/ (note: Https is also an option for a connection).
The default login password:
login: admin
password: admin
You can change that via GUI than by going to Menu > LPAR2RRD > User Management.
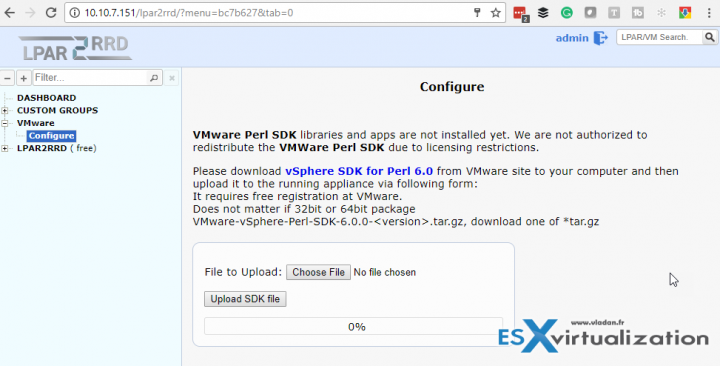
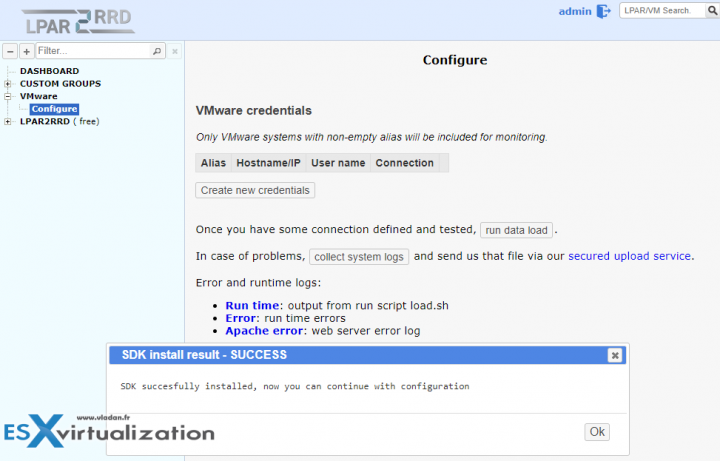
Step 3: Install VMware SDK for your environment. (link within UI). You need to go to VMware site to get this package > identify yourself with VMware account > Download the package to your hard drive > Upload and the install.
Here you can see the final screen.
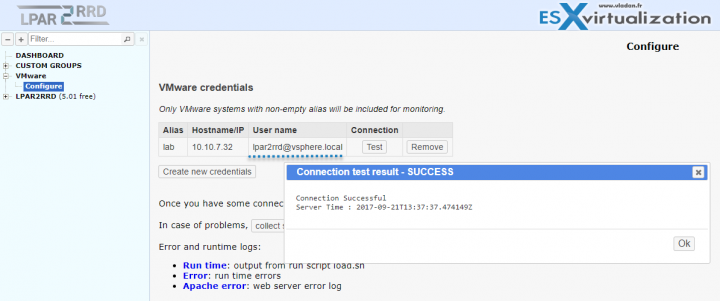
Step 4: Creation of alias and connection to your vCenter. The alias will appear within LPAR2RRD dashboard afterward so you might want to respect some guidance if you want to add several vCenters, ESXi or storage systems.
There is a certain format to respect for the connection. In my test, I created a vCenter server connection whereas a username I used [email protected] syntax, with the password you assign during the user's creation in step 0.
Check the picture below. Make sure to hit the test button to test the connection, just in case you make a typo.
Now we're done with the install/config and configuration. In my environment, it took some time (like 5-10 minutes perhaps) until I saw some new stuff coming within the UI and it took my environment into account. My lab has 3 ESXi hosts only and I'm using VMware vCenter server appliance (vCSA). Xorux documentation states that for large environments it could take up to 30 minutes.
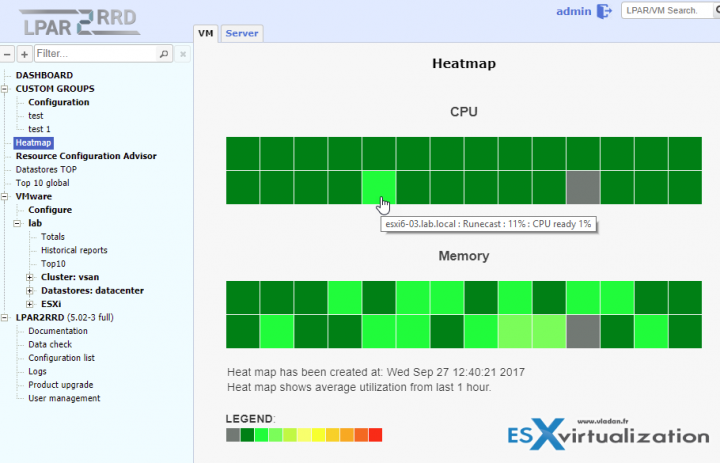
Overview of the Heatmap view giving you the CPU and Memory usage of your VMs during last hour. Pretty cool as if anything wrong here is clickable so you can, for example, click directly on a VM to get the details. Even more, only by hovering the mouse over one of the squares, you can see:
- What's the underlying host
- Which VM is impacted
- What's the Guest OS CPU consumption
- What's the CPU Ready value on the host
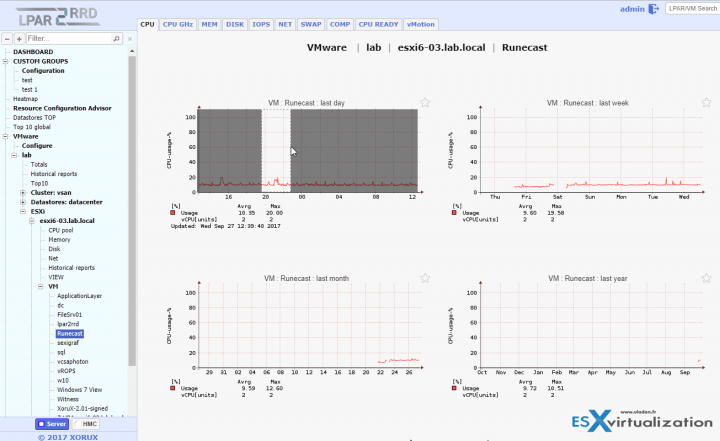
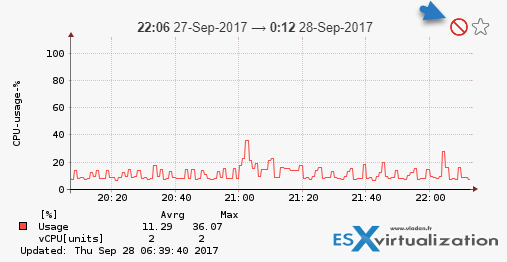
If you go and click the square (in our case it's a Runecast VM), you'll get directly into the VM's details showing me that the average CPU usage of this VM within past day was 11%.
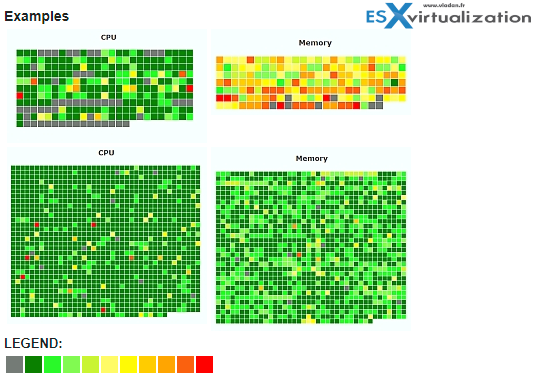
This is my small lab with dozens of VMs, but you might wonder how does it look like in real enterprise environment with hundreds of VMs? Here is an example from Xorux website, where you'll be able to see that…
Drill Down with Zooming Feature within each graph
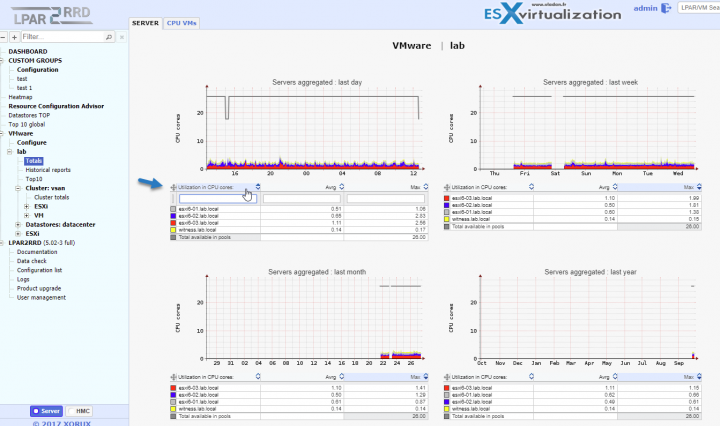
On the first tab, you have 4 graphs. Each graph, Day, Last Week, Last Month, Last Year, has a selectable area so you can focus on specific time during your last day, week, month, year etc…. After you select the area (click and hold, then drag to the right).
As a result, you can see a particular area, where there was a CPU spike, in a larger view. You can repeat the operation to further drill down. Single click on the zoom reset icon (see below) will reset the view. By clicking the Favorite icon (a Yellow Star) will add this graph to the dashboard. This particular feature is working via your browser's preferences and uses cookies to keep track of those dashboards.
Different other tabs allow you to show other metrics such as:
- Consumed GHz
- Memory
- Network
- Swap
- CPU ready
- Historical data on the vMotion activity of the particular VM.
Useful and powerful indeed. As you can see, it's possible to quickly drill down into a point which is “hot”. A VM consuming too many resources than it should is a principal pain of every admin.
Show Cluster Resouces
But let's explore more important parts of the UI which are certainly cluster or (and) host resources. The hierarchy of my lab has been discovered by the tool automatically. I mean I did not have to specify what is my cluster or what is my vCenter server.
My main datacenter view has the Totals menu where you can see the different ESXi hosts and (Note that the table is sortable by clicking the top column). Two tabs are available there:
- Server
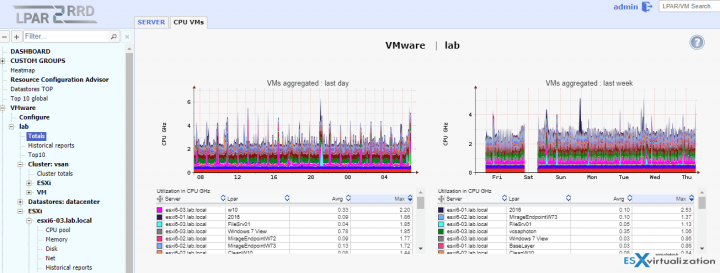
- CPU VMs
And also you can use a filter when clicking below, and type beginning of the name of your host, it gets filtered…
Here is a view from CPU VMs totalizing the CPU (GHz) consumption and performance of all VMs within the cluster.
The product truly matches your environment. After you create the first connection to your vCenter, all hosts and hierarchy are discovered by the tool. You can also manage several vCenter servers within the tool.
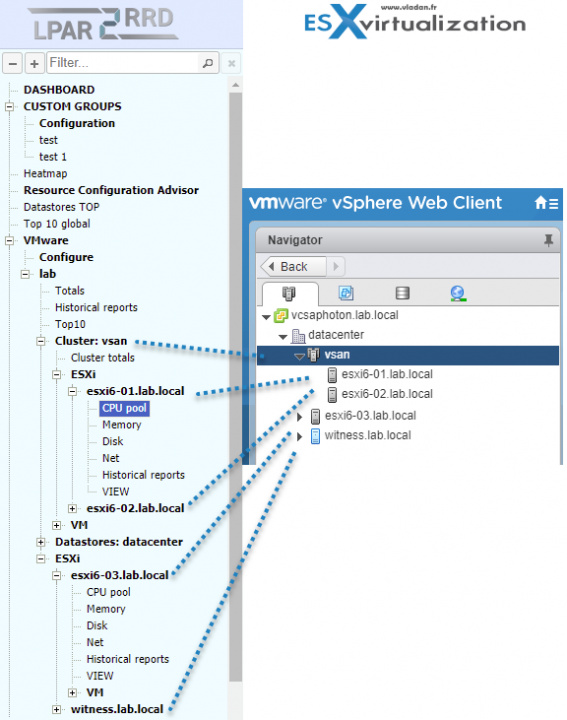
Here is a view comparing the LPAR2RRD and vSphere web client view. Note that I'm running 2-Node vSAN cluster in my lab, where the third host is outside of the cluster (vSAN requirements) and runs nested Witness which stores metadata.
How about performance?
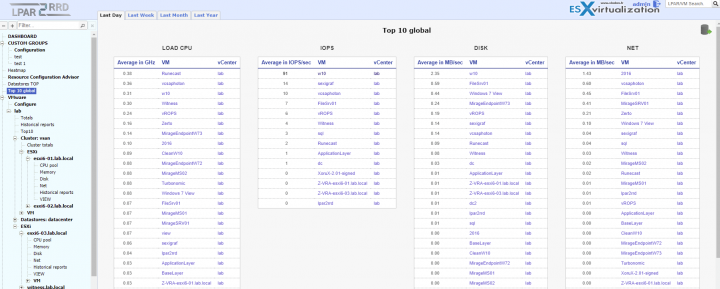
Can I monitor the performance of my backend storage? Or which one is the top VMs consuming the most IOPS within my environment? Yes, all this is possible through the Top 10 global and Datastores TOP menu on the left-hand side.
Here is a Top 10 Global view showing:
- CPU load of individual VMs
- IOPS per VM
- Disk in MB/sec
- Network access consumption/speed in average
And if we look into the Datastores TOP, at first we cannot see anything, because we have a choice whether we want to change the default date range. If we want to keep the default view, just hit Show top datastores button.
You can also change the date range and again, hit that button. We can track the performance of our shared storage or local storage of our individual hosts.
We can see different metrics there, such as:
- IO read IOPS
- Write IOPS
- Reads MB/sec
- Writes MB/sec
- Latency read (milliseconds)
- Latency write (milliseconds)
- Used
- Free
- Provisioned
All columns are again, sortable, and also you can as in our first example, you can add a filter to be able to see only the storage which you're interested in. You can for example track datastores which shows write latency greater than 10 ms by entering
> 10
And as a result, you'll only see those datastores…
Those might be small things for some, but I found it easy to use and fast. The system is really fast and you have no delay when asking for some view.
Detection of Misconfiguration
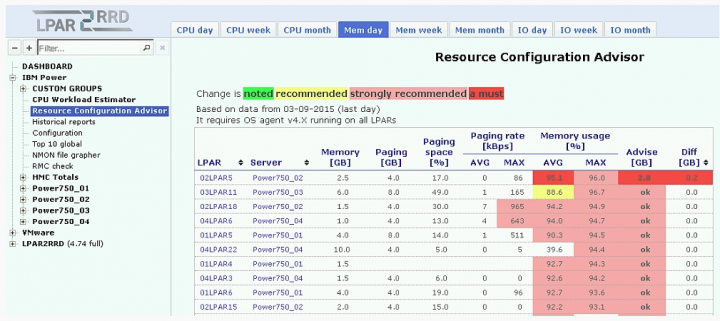
Misconfiguration. A particular VM might need more (or less) vCPUs. Am I able to detect that? The VMs as they perform, during certain periods, they need more CPU power and more memory. And then during certain periods, they don't. The system is able to detect which VMs on the long run should be resized or not.
The menu is called Resource Configuration Advisor and it shows only,
for CPU:
VMs or ESXi pools where at least one CPU MAX 10 MIN peak in given time period has been 100% or average is higher 80%, or at least one CPU Ready MAX 10 MIN peak has been 100% or average is higher 5%.
And for Memory:
VMs or ESXi pools where at least one Memory active MAX 10 MIN peak in given time period has been 100% or average is higher 80%, or any from Balooned, Swapped, Compressed is higher than 0.
For now, it won't show you how much memory or vCPUs you should add/remove, but future releases shall integrate more. Let's look at an example from Xorux as my small environment did not show anything.
Custom Dashboards
One of the things that admin appreciate is a possibility to create custom groups. In my small lab, I tried to create groups of my VMware Mirage servers. As a result, it shows directly in the main Dashboard, along with the test group which was pre-defined by default.
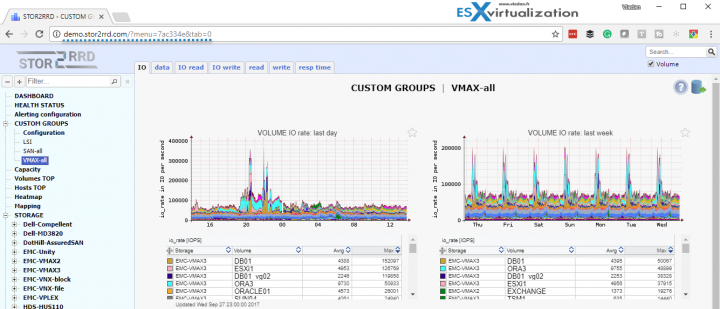
You can find more, much more via their demo system freely accessible online. Check out the screenshot below where I picked the VMAX section showing the volume IO rate for their different arrays they monitor there.
You can connect to this demo via:
Here is the view.
Reporting capabilities
LPAR2RRD can do historical reporting (graph, CSV, PDF, XLS, JSON, XML), things which are usually necessary to follow up on different resources or VMs. That's where Xorux and paid support is able to adapt the product to your existing billing system so you can know not only how much resources have been used, but also able to send an invoice to your clients or customers, with details of consumption and rate.
If you use their premium support subscription, you can use a framework which exports capacity allocation data from the tool in the format required by each of your customers. They further offer a possibility to automatically create those reports and saving them in predefined location or sending them via e-mail.
You can opt for one or more servers in a single report. Also, daily/weekly/monthly or custom date based reports are available.
The tool is able to provide base data for your server accounting like:
- CPU allocated
- CPU used
- Memory allocated
- Memory used
Wrap UP:
We did not go into every detail of this free product but tried to get the main features, including the installation steps so you can easily test it. You can explore all the features and functions by yourself and have a look also in the powerful reporting capabilities.
Xorux does provide just limited support services if you run into troubles while using STOR2RRD. Support and guarantees are available on commercial terms from XORUX or their partners. I had assisted to a presentation demo of LPAR2RRD and had the feeling that not only the product covers very large part of essential metrics, features, and benefits. I would not think that this product can be used, for example, also for migrations. But yes, by recording the VMs/application performance before migration, you are able to size the destination infrastructure accordingly, without over (under) provisioning.
This review has covered only a part of what the product is capable of. We agree, but it's impossible within such a limited space, to cover everything. We tried to give an honest view of the product's capabilities and possibilities. You can easily test it, it's Free, with only a few things available via paid support. For example, the custom groups are limited to two only within the Free product. Via paid support you'll get unlimited custom groups.
The LPAR2RRD product is fast and responsive. True, the UI is n't the fanciest one, but it does its job, and fast. Without any plugin. The setup is easy. You can be up and running within 5-10 minutes. Please note that this detailed review was sponsored by Xorux.

