New update to Microsoft's tool which can diagnose Process crashes, memory leaks and overall process performance has been released recently. The tool has been around for a while but now it's available as a standalone MSI package (for x32 or x64). The utility is called DebugDiag and it's a free download.
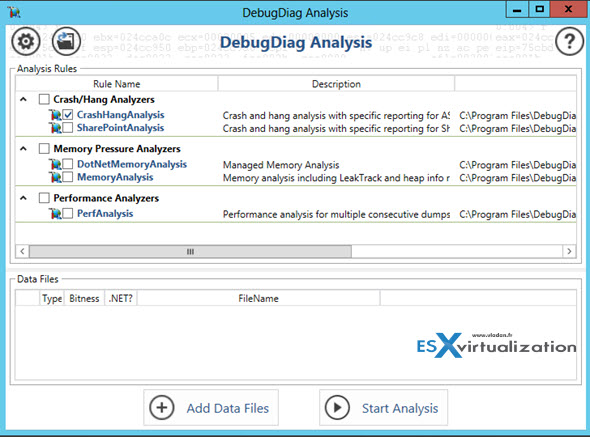
This 2.0 U1 version includes an all-new analysis engine host, which simplifies analysis rule development in .NET. and comes with a built-in reporting framework, whcih can be accessed from .NET. It has built-in analysis rules which diggs in web data access components, COM+, SharePoint, Internet Information Services (IIS) applications and other Microsoft software and services to get performance related informations.
Quote from the site:
DebugDiag is designed to assist in troubleshooting issues such as hangs, slow performance, memory leaks or memory fragmentation, and crashes in any user-mode process.
The utility is supported with following OS:
Collection Module:
============
Windows 2008
Windows Vista
Windows 2008 R2
Windows 7
Windows Server 2012
Windows 8
Windows Server 2012 R2
Windows 8.1
Analysis Module:
============
.NET 4.0
Windows 2008
Windows Vista
Windows 2008 R2
Windows 7
Windows Server 2012
Windows 8
Windows Server 2012 R2
Windows 8.1
How-to use DebugDiag utility?

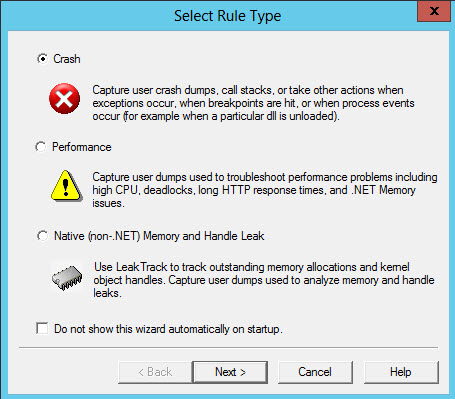
After launching the DebugDiag.Collection.exe executable, a wizard appears allowing the user to configure rules which are designed to assist in troubleshooting crashes, hangs, and memory leaks.
The program consists of two primary tabs (views):
Rules TAB – Allows you to add, edit or delete rules which govern the type of monitoring and diagnostics tha you want to execute and get the current status of any of the active or inactive rules.
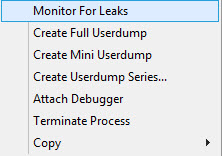
- Processes TAB – displays list of processes currently running on the machine and also detailed info about individual process. You can right click a process > then choose Monitor for leaks from the menu. What it does, it injects leaktrack.dll into the process and begin the leak monitoring process. It's recommended to leave the process to run at least for 1 hour.
The Wizard screen:
Get the Free tool from Microsoft's website here.


 Rules TAB – Allows you to add, edit or delete rules which govern the type of monitoring and diagnostics tha you want to execute and get the current status of any of the active or inactive rules.