VMware Admins has got another choice for free monitoring of ESX(i) hosts and managing them.
First of all, I'd like to welcome Solarwinds as a new sponsor for my ESX Virtualization MAG website. If you're not a regular reader, consider subscribing by Google Reader (or other RSS reader), because with the daily website updates you will not miss an article. The subscriptions are Free. In case you don't know how to use RSS, read my page on how to use RSS here.
Every time I publish a new article it's also published on Twitter. You can follow me to get the latest updates. Nice application for using Twitter is Tweet Deck.
Solarwinds has got many free tools available on their website. Today I choose two of them, which can be used by VMware admins to monitor and manage their ESX(i) hosts and also by adding vCenter to the VM Console. The first free tool is called VM Monitor.
VM Monitor.
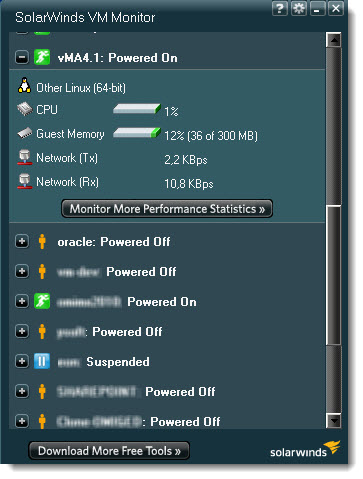
By using VM Monitor you can monitor individual ESX(i)hosts in your infrastructure. This tool is especially useful for free versions of ESXi 4.1, because it does only supports individual hosts, not a vCenter.
 You can install VM Monitor on a PC or Server. Those are the version of Windows supported:
– Windows XP SP3, Vista, W7, Server 2003, Server 2008
As a prerequisites you have to install .NET Framework 3.5 or later. The application won't start its installation process if .NET is not installed. Instead it fires on your default browser and connects you to Microsoft website for you to download the .NET package.
If you don't want to wait for 240 Megs to download and you have the whole package available on your network, you'll probably launch the installation of .NET from the full package instead.
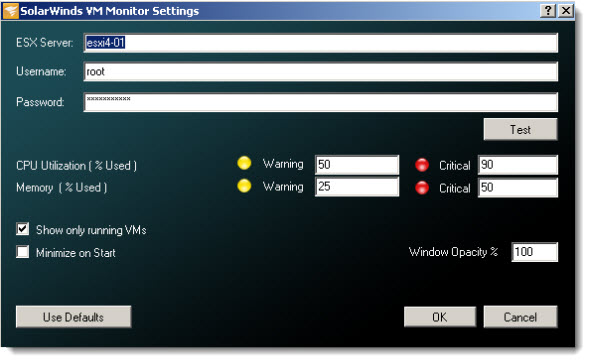
After .NET installed, you can install the application which then asks you about the ESX(i) hosts address and login/password combination. There is a test button which verify the connection for you before you click on the OK button.
You also have other possibilities in the configuration window. You can for example setup the thresholds for critical CPU utilisation and Memory used. Both values are in percents. Those warning and Critical values can be modifyed or you can set the default value by clicking the Use Defaults Button. since each one of them has different color. Warning – yellow, Critical – red.
The tool can also be configured for automatic minimized start with windows and you can also set the opacity.
You can see the configuration window on the screenshot below:
When you click on the plus sign located on the side of the icon of the VM, you'll expand and see detailed information about the particular VM. If its Linux or Windows VM, or what's the CPU/Memory utilization and also the network throughput for this particular VM.
Show only running VMs is quite useful, when you have a bunch of VM which just “sleep” on your server and you don't want to see all those VMs in your VM Monitor console.
The color the icon depends of the health of the VM. Can be Green, Yellow, Red, Blue (suspended VM) , or with the icon of Person which is VM powered Off.
You can download the Free VM Monitor from Solarwind's Website here.
VM Console
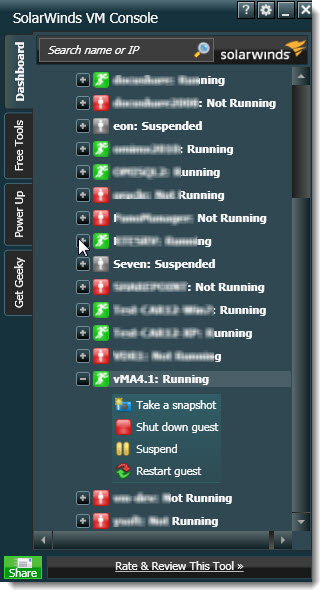
The second tool I'll present here is the tool called VM Console. With VM console you can handle several ESX(i) hosts at the same time and you also have the possibility to restart/suspend/snapshot individual VMs.
 What's the requirements to install this free tool?
Basically the same except that you can run it also on Win XPSP2, but you'll need Vista business or Ultimate and Windows Server 2003 has to have a SP1 installed.
Also note that using vCenter version 3.5 or later is required in case you want to add a vCenter to your VM Console (yes it's possible, see on the picture below).
Also note that the installation needs 100 Megs on your hard drive.
Concerning the possibilities. They are numerous. Each VM is represented by icon, like in the VM Monitor, but the colors has different meanings.
Red – VM not running, Green – VM is running, Grey – VM Suspended
When you expand the plus sign, you'll got different possibilities:
– Take a snapshot of a particular VM. What's cool is that when you click on the snapshot button, this brings in a new small window which is already pre-filled with Name and Description fields (which are modifiable), and also the date, time and user connection.
– Start a VM. When the VM is not running, the only available buttons are Start Guest and Take a snapshot.
– Suspend. The Suspend button is present only when VM is running. Very convenient since at the same time it saves place on the console too…
– Take a Snapshot – brings in a small window with the pre-filled informations I talked about earlier.
– Restart Guest – restarts a VM (in the options you have the possibility to create a snapshot automatically when you restart a VM).
– Shut down guest – this button should gracefully shut down a VM, but it does not. A bug? I found that I'm not the only one who noticed this behavior on the forums.
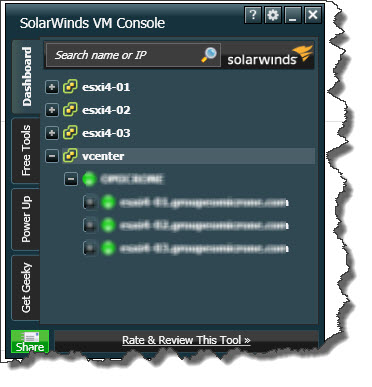 As I said, you're able to add individual ESX(i) hosts or you can also add your vCenter Server (in case you're using one).
The search name or IP form helps you while searching for individual VM. You can enter just first three characters and hit enter to find a particular VM which is very convenient for large infrastructures.
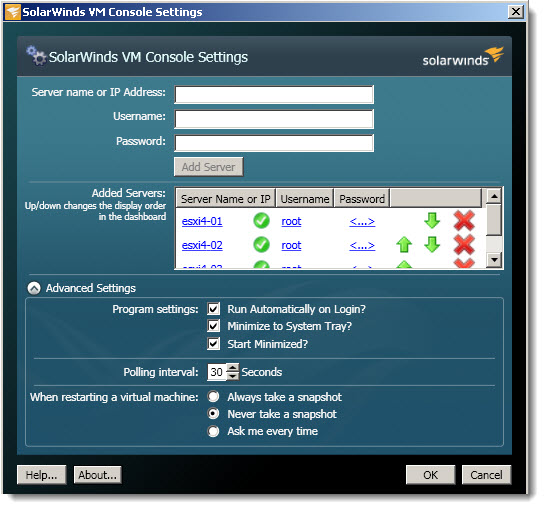
You can see the configuration window possibility bellow.
The configuration window permits you to Add/remove new individual ESX(i) servers or vCenter servers. You can also add both (ESX servers and vCenter), but then the searching feature I talked above will bring two results for a particular VM.
Also you have the Advanced Settings options which permits you to configure the Automatic snapshot feature as I wrote above.
The automatic polling interval is set to 30 seconds by default, but you can change it.
Those tools are Free and easy to use. The only trouble that I could find was the Shut down button which makes Power Off action instead of graceful shutdown. You better be aware of that.
You can downlad the Free VM Console from Solarwind's Website here.
Both tools are Free to download and use. Enjoy and see more on Solarwind's Website.
