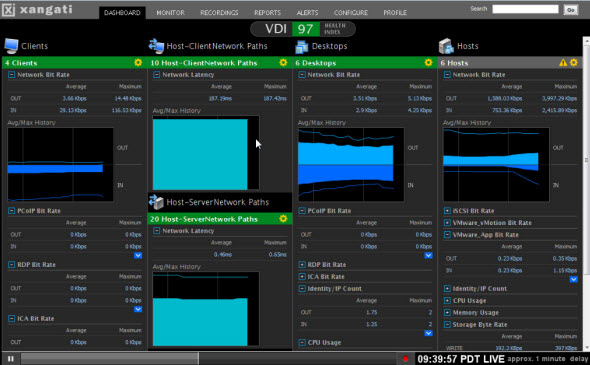
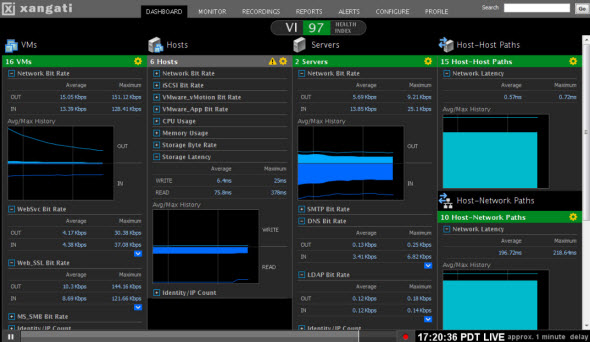
Xangati VDI dashboard has been released.
Real time monitoring with Xangati for ESX gives you the drill down possibility to look and find which part of your virtual infrastructure is suffering from slowdowns and for which reason. Xangati now goes even further and announcing a new product called Xangati VDI dashboard.
As you can see from the name of the product, it's utilization is oriented for Virtual Desktops. You're able to monitor your VDI infrastructure within your company and you're aware of any slowdowns or problems. Also the ticketing support is present with Recording capability which gives you the record/replay possibility and visualize an eventual congestion during a specific period.
VDI is being continuously monitored across a broad spectrum of performance metrics to the unrivaled scale of 250,000 objects – desktops and clients.
Few weeks earlier Xangati has released an enhanced version of Xangati for ESX, which is free.
A quick quote from Xangati:
All VDI Operations in a Single Pane of Glass
For the very first time, a VDI team can see in one pane of glass all the critical components that sustain the VDI, as well as the desktops and their clients. Through this structure, the Xangati solution is the only purpose-built dashboard framed to replicate how a VDI administrator seeks to run their operations. Additionally, the VDI dashboard incorporates Xangati’s visual trouble ticketing model that allows end-users to initiate DVR recordings when they are experiencing issues. In this manner, the VDI administrator can see, for example, that a user’s poor VDI experience on an iPad is due to a highly congested WiFi network.
Here is the full press release:
Cupertino, CA – March 22, 2011 – Xangati, the recognized leader in infrastructure performance management, today introduced the Xangati VDI Dashboard, the industry’s first solution designed to comprehensively track all key infrastructure components that affect VDI performance, giving administrators the confidence and ability to successfully implement large-scale VDI deployments. Leveraging Xangati’s powerful real-time memory-based analytics engine architecture, the Xangati VDI Dashboard tracks and continuously monitors activity of all VDI components within the infrastructure without requiring any agents. The new dashboard also includes a performance health engine that automatically and visually alerts administrators in real-time about the precise location of performance issues.
By providing a solution that covers components in and outside of the virtual infrastructure (VI), the Xangati VDI Dashboard gives administrators comprehensive “cross silo” awareness into all critical elements linked to – including clients, desktops, networks, servers, storage, applications and VDI protocols – which ultimately provides a positive VDI user experience.
“The ultimate success of VDI projects depends 100 percent on the ability to provide users with the same level of application performance and availability that they are accustomed to in conventional desktop environments,” said Alan Robin, CEO of Xangati. “However, prior to the release of Xangati’s solution, VDI administrators were flying blind to the source of end-user performance issues not linked to their VDI software – oftentimes leading to stalled implementations and cancelled projects. Xangati is the first to market with a solution to tackle these challenges head on through a UI structured specifically for VDI support, an agent-free model, and a rapid installation process that provides immediate download to value.”
“Xangati has once again demonstrated its talent for developing and delivering innovative infrastructure performance management solutions that are needed to help businesses successfully implement and benefit from emerging and transformational technologies, such as VDI,” said Bernd Harzog, analyst of virtualization performance and capacity management at The Virtualization Practice. “Its new dashboard not only gives the highest level of visibility into all the moving parts in the VDI ecosystem but also extends its real-time and continuous monitoring to include proactive, system-generated health alerts and visual recordings about performance issues.”
Through relationships and support from VMware and Citrix, Xangati has designed the Xangati VDI Dashboard to fully complement both VMware View and Citrix XenDesktop environments.
Xangati VDI Dashboard: Breakthrough Features
Real-time Performance Health Engine
The cornerstone of the Xangati VDI Dashboard is its patent-pending performance health engine that analyzes the health of VDI in an unprecedented four microseconds. Relying on Xangati’s memory-driven architecture, the performance health of the VDI is being continuously monitored across a broad spectrum of performance metrics to the unrivaled scale of 250,000 objects (which can include desktops and clients). In contrast, other performance management architectures are database-driven and unable to keep apace of dynamic interactions to scale that are fundamental to VDI.
The output of Xangati’s performance health engine is a real-time health index that is linked to the health of every client, desktop, network link, host, VDI protocol and IT server that can impact VDI end–user experience. In real-time – as an object’s health shifts – the health index changes to reflect the urgency of the performance issue. Moreover, the performance shift will trigger a real-time alert, which is uniquely paired with a DVR-recording.
The DVR-recording will show exactly where the performance problem stems from and present contextual insights about what is driving the sub-optimal performance. For instance, a specific user community is seeing obvious delays in screen presentation due to a high latency network link. These DVR recordings capture issues that are often outside of a VDI vendor’s software framework and can be passed to the appropriate IT function, e.g. to the storage team when storage latency is at the heart of the performance issue.
All VDI Operations in a Single Pane of Glass
For the very first time, a VDI team can see in one pane of glass all the critical components that sustain the VDI, as well as the desktops and their clients. Through this structure, the Xangati solution is the only purpose-built dashboard framed to replicate how a VDI administrator seeks to run their operations. Additionally, the VDI dashboard incorporates Xangati’s visual trouble ticketing model that allows end-users to initiate DVR recordings when they are experiencing issues. In this manner, the VDI administrator can see, for example, that a user’s poor VDI experience on an iPAD is due to a highly congested WiFi network.
In contrast to other solutions marketed as VDI-focused, the Xangati solution can populate itself with incredibly rich data without requiring guest software agents. It is this agent-free model that allows Xangati to be deployed rapidly, even during proof of concept phases, as well as when an enterprise wishes to scale their virtual desktops into the thousands or tens of thousands.
Pricing and Availability
The Xangati VDI Dashboard is available immediately and can also be downloaded for a free two-week trial via the Xangati website. Priced at just $25 per desktop in a starter kit of 100 desktops, the Xangati VDI Dashboard enables a company to implement a VDI initiative for just $2,499 – making it one of the most affordable options today. For more information about the new Xangati VDI Dashboard and to access a free trial, go to https://xangati.com/VDI_dashboard.
Source: Xangati


