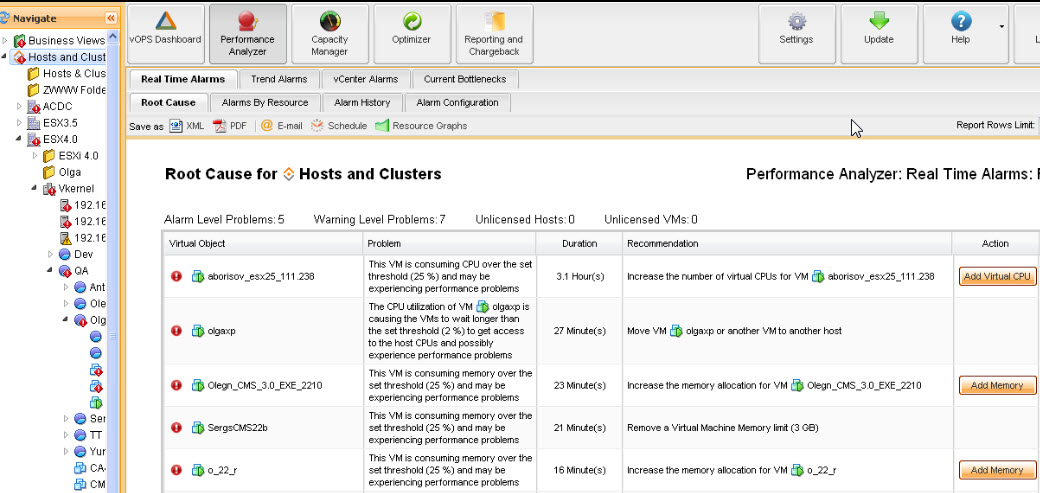
There has been a new product release at Vkernel called Performance Analyser 1.0.
The VKernel Performance Analyzer not only monitors, diagnoses but also resolves performance issues in virtual environments. Performance Analyzer works side by side with monitoring and alarming features present in vCenter.
The product is part of the vOperation Suite (formerly VKernel Capacity Management Suite)
A quick quote from Vkernel:
It uses real time analysis of system metrics and vCenter alerts to determine abnormal trends and root cause, impact, and resolution of immediate VM performance issues. Performance Analyzer is unique in its use of advanced analytics combined with an intuitive user interface to complement VMware vCenter's warning engine. By using this VM monitoring solution, virtualization administrators are able to quickly solve VM performance problems.
You can Download Press Release in PDF format
You can download Performance Analyzer through this link.
Concerning the installation, the product installs as a single agent-less virtual appliance in 20 minutes and a 30 day free trial for all applications within the suite is immediately available.
What's the requirements?
- VMware ESX 3.0 or vCenter 2.5 or higher
- 1 vCPU if under 200 VMs in the environment, 2 vCPUs if 200-1500 VMs in the environment, 4 vCPUs if greater than 1500 VMs in the environment
- 3 GB of memory
- 10 GB of storage space
A quick overiew of vKernel Performance Analyser video:
Video How to install the product:
– Root Cause Monitor Screen lists the root cause behind multiple vCenter alerts with resolution recommendations
– Impact Analysis Drill Down Report identifies all VMs and datastores impacted by an issue
– One-Click Issue Remediation implements recommendations automatically through vCenter integration
– The Current Bottlenecks Heat Map shows where an environment is experiencing resource constraints
– The Current Bottlenecks Drill Down Report shows root cause, impact analysis, and a resolution recommendation to eliminate an environment capacity constraint
– The Alarm by Virtual Object Heat Map provides instant visibility into performance-affecting alarms for all objects in an environment
– Trend Alarms can be set at all virtual infrastructure levels to alert when abnormal utilization behavior is occurring
– Resource Graphs can be launched on the virtual object the user has selected to visualize system metric activity
– The vCenter Alert Auto-configurator sets vCenter alerts to best practices values (enabled for select vCenter alerts)
Source: Vkernel

