Last week VMware Labs has released Free ESXTOP vSphere Web Client Plugin, which is very interesting Add-on for vSphere Web Client. After the full GUI based version of ESXtop client called Visual ESXTOP (based on Java) this version integrates directly into the vSphere Web Client. It's easy to install but there are few limitations.
It seems that this version can only be used with the VCSA (Linux appliance) of vCenter as it's stated as a requirement. Also, users of older version of vCenter server (5.0 and 5.1) are left behind as this version is compatible with version 5.5 only.
ESXTOP vSphere Web Client Plugin – The Features:
- Separate tabs for CPU, memory, network and disk performance statistics
- Flexible batch output
- Flexible counter selection
- Advanced data grid for displaying stats (sortable columns, expandable rows, etc.)
- Configurable refresh rate
- VM-only stats
- Embedded tooltip for counter description
How to Install?
The installation is pretty simple. I'll show thoe few steps for new users willing to try. Usually you know your way, but new folks learning stuff will want probably check how to get started. Here is how:
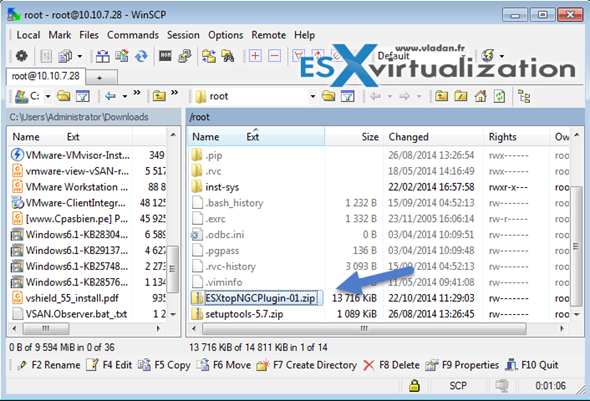
1. Upload the zip file you just downloaded from VMware Labs (file called ESXtopNGCPlugin-01.zip), to the root folder of the VCSA appliance (WinSCP does good job).

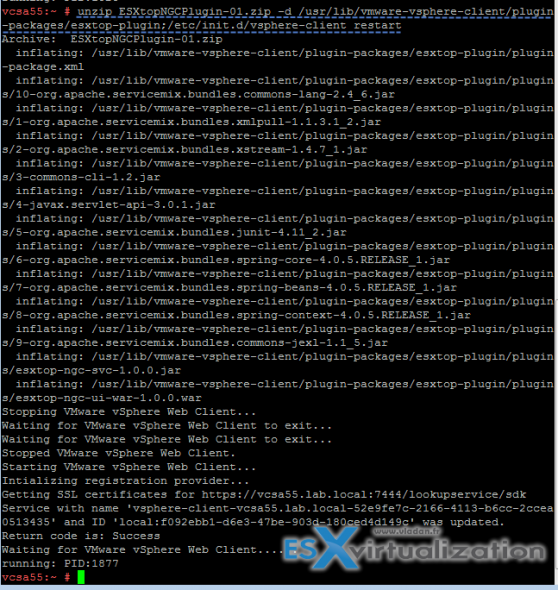
2. Connect with Putty via SSH to the vCenter Server Appliance (VCSA) and navigate to the root directory where you have just copied the file.
unzip ESXtopNGCPlugin-01.zip -d /usr/lib/vmware-vsphere-client/plugin-packages/esxtop-plugin;/etc/init.d/vsphere-client restart
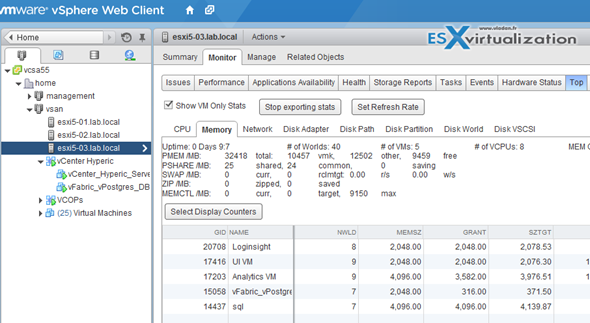
3. That's all folks. The command restarts the vSphere web client automatically, so wait and when it's completed you can just start the vSphere Web Client, select a host and then Monitor tab > Check the new TOP label. When clicking after few seconds the data shall appear.
Note that you can set the refresh rate with the large button there, or you can also select the display counters.
I really like the web client integration even if there is a slight delay compared to direct connection with Putty, but it's easy and convenient way to gather performance data from within the same console – web client. I know the web client isn't as fast as vSphere C++ client, but the version 6.0 of vSphere shall feature more faster version and give an experience close to the C++ client. (they shifting things around I've heard)…
Check my Free Tools Page to find you preferred tool and stay tuned for more.
Source: VMware Labs


Nice article. I’ll have to give it a try.
By the way – good luck getting winscp to work with vCenter VCSA 6. Locked it down.
Tom
I have followed the same command and steps mentioned to use this tool with VC 5.5 version ( Build 19452887_5.5.U1) But i dont TOP button on webclient after restarting vsphre client, VC VM or ESX itself. Please let me know is there is any step i am missing other than above mentioned 2 steps..
The way I wrote the post it works. In your case, did the command completed successfully? Just the vsphere web client service on the VCSA needs to be restarted.
My client keeps crashing with error #1009 and I do not get any stats.