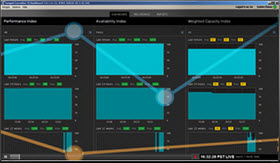
Xangati just announced two new dashboards in their software suite. Xangati is a specialist in end-to-end real time monitoring, but their product offers some unique capabilities, like storm tracking or automatic recording when your infrastructure is performing badly. There is new Executive Dashboard which offers an overall view of VDI and VI components and also detailed recordings and reporting. This is the main window which is simple to use and operate single dashboard.

The full suite called XSR11 consists of Four main dashboards:
- Xangati VDI dashboard
- Xangati VI dashboard
- Xangati Network Suite – network performance monitoring, end-to-end visibility
- Xangati for vSphere (Free tool)
The main benefit is to be able to see where the bottleneck is occurring, in the real time. It effectively helps to solve problems faster.
You can of course download 30 days trial or the free Xangati for vSphere. What I liked in the past, with Xangati was the recording possibility. And it's still present as it very popular. When used with VDI, the remote users, if experiencing difficulties (slow network, slow application) when accessing their Virtual desktops, they’re able to record the situation…. They’re actually can click on a button in a webpage to record the situation they’re in. They can trigger the DVR recording remotely together with creating a support ticket as Xangati has a built-in ticketing system too….
A quick video from Xangati showing demo of the new dashboards:
Here is a part of the press release:
The Xangati MyDashboard allows users to customize their views to include, for example, just a particular application, or just the activity of a particular data center, cost center, or department – according to individual need or preference – to create a comprehensive aggregated performance index or even to create a live view of activity at a particular instant. Or a customized view can be built around multiple objects of the same type, such as groups of virtual machines, desktops, desktop pools, hosts, datastores, network interfaces, or physical endpoints or servers. MyDashboard therefore extends the benefits of real-time performance monitoring to business-unit executives and managers, allowing them to better manage application workloads in their virtualized environments.
The Xangati suite also incorporates the company’s StormTracker technology, which tracks and analyzes contention storms on the network, and for any virtualized workloads, whether VDI, VI or VNI (Virtual Network Infrastructure). Any authorized user, and even external users with authorization, can then submit a Visual Trouble Ticket, through which end-user issues can be tracked on a recording portal integrated with the organization’s service desk. This capability extends even to WMI (Windows Management Instrumentation), allowing administrators to specify multiple sets of global credentials to facilitate support for multiple Windows domains, to enable or disable WMI access globally or to individual Windows machines, or to perform bulk updates for WMI configuration.
“Even the highest-performing and best-managed cloud environments can be afflicted by storage storms, CPU storms, memory storms, and boot storms, crippling applications and disrupting end-user experiences,” said Sundi Sundaresh, CEO of Xangati. “With StormTracker, you can immediately identify storms and gain second-by-second insights, proactively track their impact, and quickly remediate them. The benefits are twofold: organizations can not only maximize the ROI on their network infrastructure, but now have the ironclad performance stats they need to meet SLA commitments to their users.”
Source: Xangati
