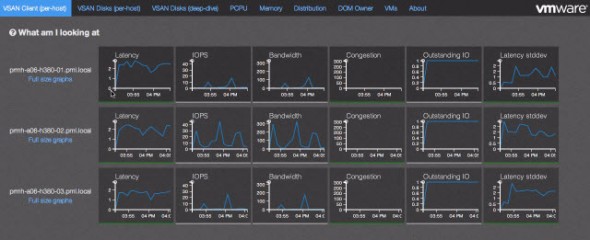
VMware VSAN which has been introduced during VMworld 2013 in SF allows to use local disks together with local SSDs (for acceleration) to create a pool of storage visible to all hosts in the cluster as a shared datastore. The product is not available yet. Here are some news about some cool management tools are showing up. Tools like VSAN Observer allows to monitor latency, IOPS, Bandwidth, Health statistics of the VSAN disks or consumption of the VSAN memory pools.
VMware vSphere blog has published a brief with a video showing the walkthrough through the web based interface, which is powered by Ruby vSphere Console (RVC) based on Ruby language and RbVmomi binding APIs for vSphere.
vSphere 5.5 will be shipping with RVC, which will integrate a certain number of Virtual SAN (VSAN) built-in functionalities.
Quick quote from the source:
The VSAN Observer is an RVC experimental graphical user interface utility which displays VSAN related statistics from a VSAN Client perspective. The utility can be used to understand VSAN performance characteristics. The utility is intended to provide deeper insights of VSAN performance characteristics and analytics. The VSAN Observer’s user interface displays performance information of the following items:
- Statistics of the physical disk layer
- Deep dive physical disks group details
- CPU Usage Statistics
- Consumption of VSAN memory pools
- Physical and In-memory object distribution across VSAN clusters
There is also a video showing the UI.
VMware VSAN is in beta right now. You can register, if you want to test this product at https://www.vsanbeta.com
Source: VMware vSphere Blog
Enjoy…

