We continue to fill our VCP6.5-DCV Study guide page with one objective per day. Today's chapter is VCP6.5-DCV Objective 7.4 – Troubleshoot Virtual Machines. We cover each chapter from the VMware Exam Guide (PDF) for VCP6.5-DCV. You can get the PDF from this page (previously called Exam Blueprint).
Not many free VCP6.5-DCV study guides are online so far, so we thought that it might be a good idea to get things up and try to contribute.
You still have a choice to pass VCP6-DCV, but I think the moment is for the majority of new VCP candidates, to go for the VCP6.5-DCV. The VCP6-DCV has few topics less to study.
Exam Price: $250 USD, there are 70 Questions (single and multiple answers), passing score 300, and you have 105 min to complete the test.
Check our VCP6.5-DCV Study Guide Page.
You can download your free copy via this link – Download Free VCP6.5-DCV Study Guide at Nakivo.
VCP6.5-DCV Objective 7.4 – Troubleshoot Virtual Machines
- Monitor CPU and memory usage
- Identify and isolate CPU and memory contention issues
- Recognize impact of using CPU/memory limits, reservations andDescribe and differentiate critical performance metrics
- Describe and differentiate common metrics, including:
- Memory
- CPU
- Network
- Storage
- Monitor performance through esxtop
- Troubleshoot Enhanced vMotion Compatibility (EVC) issues
- Compare and contrast Overview and Advanced Charts
Monitor CPU and memory usage
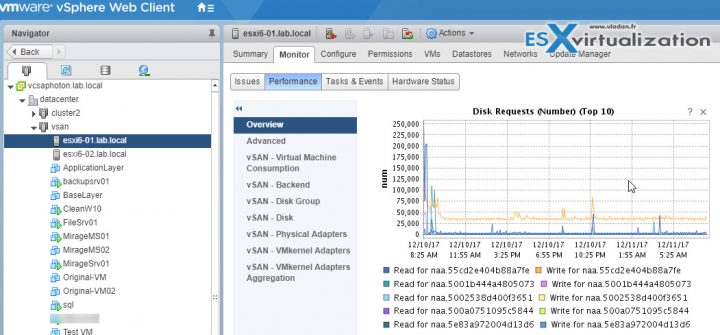
vSphere 6.5 has charts and graphs which allows you to monitor different parts of the infrastructure such as hosts, VMs etc.
Hosts – you'll find information about CPU, disk, memory, network, and storage usage for hosts. The counters available depends on the collection level for vCenter Server.
- CPU (%) – The CPU (%) chart displays CPU usage for the host.
- CPU (MHz) – CPU usage for the host.
- CPU Usage – shows CPU usage of the 10 virtual machines on the host with the most CPU usage.
- Memory (%) – host memory usage.
- Memory (Balloon) – shows balloon memory on a host.
- Memory (MBps) – swap in and swap out rates for a host.
- Memory (MB) – memory data counters for hosts.
- Memory Usage – shows memory usage for the 10 virtual machines on the host with the most memory usage.
Virtual Machines – VM charts show information about CPU, disk, memory, network, storage, and fault tolerance for virtual machines. The counters available are determined by the collection level set for vCenter Server.
You do the same way. Select a VM > Monitor TAB > Performance.
- CPU (%) – shows VMs CPU usage and ready values.
- CPU Usage (MHz) – virtual machine CPU usage.
- Memory (%) – virtual machine memory usage.
- Memory (MB) – shows virtual machine balloon memory.
- Memory (MBps) – shows virtual machine memory swap rates.
- Memory (MB) – shows memory data counters for virtual machines.
Identify and isolate CPU and memory contention issues
CPU ready values are the ones you should be interested in. It is the time that the VM was trying to process threads but was unable to be scheduled by the hypervisor.
When rising above 5 percent, you should start to be interested.
Memory contention at the VM level you should look into a swap in and swap out rates. Also ballooning. When VM starts having some ballooning, and then even swapping, you should verify if your host's memory isn't too much overcommitted.
Recognize impact of using CPU/memory limits, reservations and Describe and differentiate critical performance metrics
You can use resource allocation settings to allocate the amount of CPU, memory, and storage resources provided for a virtual machine. You have a choice to use:
- Shares – If a VM, or resource pool, has twice as many shares of a resource as another virtual machine, it is entitled to consume twice as much of that resource when these two virtual machines are competing for resources.
- Reservation – guaranteed minimum allocation for a virtual machine
- Limits – upper bound for CPU, memory, or storage I/O resources that can be allocated to a virtual machine
Resource Allocation Settings Suggestions
Select resource allocation settings (reservation, limit, and shares) that are appropriate for your ESXi environment.
Admission Control – When you power on a VM, the system checks the amount of CPU and memory resources that have not yet been reserved. Based on the available unreserved resources, the system determines whether it can guarantee the reservation for which the virtual machine is configured (if any). This process is called admission control.
Describe and differentiate common metrics, including:
- Memory
CPU
- %USED – Percentage of physical CPU core cycles used by the resource pool, virtual machine, or world. %USED might depend on the frequency with which the CPU core is running. When running with lower CPU core frequency, %USED can be smaller than %RUN. On CPUs which support turbo mode, CPU frequency can also be higher than the nominal (rated) frequency, and %USED can be larger than %RUN. %USED = %RUN + %SYS – %OVRLP
- %RDY – Percentage of time the resource pool, virtual machine, or world was ready to run, but was not provided CPU resources on which to execute. 100% = %RUN + %RDY + %CSTP + %WAIT
-
%CSTP – Percentage of time a resource pool spends in a ready, co-deschedule state. NOTE You might see this statistic displayed, but it is intended for VMware use only.100% = %RUN + %RDY + %CSTP + %WAIT
-
%SYS – Percentage of time spent in the ESXi VMkernel on behalf of the resource pool, virtual machine, or world to process interrupts and to perform other system activities. This time is part of the time used to calculate %USED. %USED = %RUN + %SYS – %OVRLP
-
%WAIT – Percentage of time the resource pool, virtual machine, or world spent in the blocked or busy wait state. This percentage includes the percentage of time the resource pool, virtual machine, or world was idle. 100% = %RUN + %RDY + %CSTP + %WAIT
Network
Storage
Monitor performance through esxtop
connect via SSH client and run “esxtop” command.
options :
esxtop [-h] [-v] [-b] [-s] [-a] [-c config file] [-R vm-support_dir_path] [-d delay] [-n iterations]
Then if you typ c, m, d, u, v, n, I, or p shows the window with CPU, memory, etc…
m – Memory
c – CPU
n – Network
i – Interrupts
d – Disk Adapter
u – Disk Device
v – Disk VM
p – Power states
x – vsan
Storage:
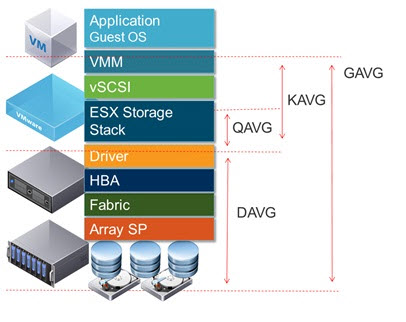
- GAVG (Guest Average Latency) total latency as seen from vSphere
- KAVG (Kernel Average Latency) time an I/O request spent waiting inside the vSphere storage stack.
- QAVG (Queue Average latency) time spent waiting in a queue inside the vSphere Storage Stack.
- DAVG (Device Average Latency) latency coming from the physical hardware, HBA, and Storage device.

Troubleshoot Enhanced vMotion Compatibility (EVC) issues
VMware vCenter server EVC verifies before it migrates running VMs to make sure that the VM is compatible with a target host.
vMotion transfers the running state of a virtual machine from one ESXi host to another. vMotion process has a requirement that the processors of the target host provide the same instructions to the virtual machine after migration that the processors of the source host provided before migration. Clock speed, cache size, and a number of cores can differ between source and target processors. The processors must come from the same vendor class (AMD or Intel) to be vMotion compatible.
Migrations of suspended VMs also require that the virtual machine be able to resume execution on the target host using equivalent instructions. When you initiate a migration with vMotion or a migration of a suspended VM, the Migrate VM wizard checks the destination host for compatibility and throws in an error if compatibility problems will prevent migration.
The CPU instruction set available to the operating system and to applications running in a virtual machine is determined at the time that a virtual machine is powered on. This CPU feature set is:
- Host CPU family and model
- Settings in the BIOS that might disable CPU features
- ESX/ESXi version running on the host
- The virtual machine’s compatibility setting
- The virtual machine’s guest operating system
In order to improve CPU compatibility between hosts of varying CPU feature sets, some host CPU features can be hidden from the virtual machine by placing the host in an Enhanced vMotion Compatibility (EVC) cluster.
Where to configure VMware Enhanced vMotion Compatibility (EVC)?
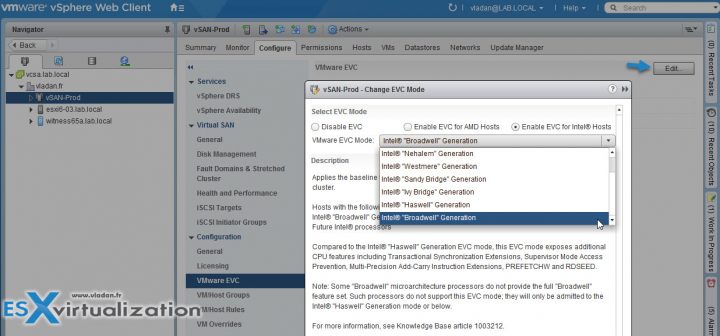
At the cluster level > Select the cluster > VMware EVC > Edit > Chose a radio button depending on your processor family (Intel/AMD) and then drop down the menu to chose which CPU family you want to choose from.
When you configure EVC, you configure all host processors in the cluster to present the feature set of a baseline processor. This baseline feature set is called the EVC mode.
Compare and contrast Overview and Advanced Charts
Advanced charts do provide:
- Customizable charts – Change chart settings. To create your own charts, save custom settings.
- More info – Hover over a data point in a chart and details about that specific data point are displayed.
- Allows you to do an export, to an XLS.
- Save to image file or spreadsheet.
You can use advanced charts to create your own charts, with the data you want.
Datacenter – provides info about CPU, disk, memory or storage usage for a datacenter. You can use help topics provided there.
Cluster – CPU, Disk, memory and network usage for clusters.
Datastore and Datastore clusters – disk usage
Host – CPU, disk, memory, network usage for hosts.
Resource pool – this chart has CPU and memory usage for resource pool.
vApps – CPU and memory usage for vApps.
VMs – CPU, disk, memory, network, storage and Fault tolerance or VMs.
Check our VCP6.5-DCV Study Guide Page for all topics.
More from ESX Virtualization
- V2V Migration with VMware – 5 Top Tips
- Configuration Maximums
- VMware Virtual Hardware Performance Optimization Tips
- What is VMware DRS (Distributed Resource Scheduler)?
- What is VMware Enhanced vMotion Compatibility (EVC)
Stay tuned through RSS, and social media channels (Twitter, FB, YouTube)


