Another interesting review today – Runecast analyzer. If you don't know Runecast analyzer just yet, I'd highly recommend taking a look as there is no equivalent. Runecast analyzer checks your environment and compares the state for misconfiguration, security or performance issues with current VMware KB articles. Every week VMware releases new KB articles and those are downloaded by the software so the current best practices stay always current. The check is dynamic. Through the time, your environment evolves, you upgrade, patch etc.
Runecast analyzer gives you at any point in time the global overview of your virtual infrastructure. The product can also collect ESXi and VMs logs, in case you configure logs forwarding. By analyzing a huge number of those logs, it can detect misconfiguration or malfunction at a certain point in time. The logs are compared to VMware best practices KB articles.
Runecast analyzer sticks to those best practices not only for hardware but also for software. Every single VM in your environment gets a deep analysis so whether the VM's virtual hardware or the VMs OS configuration isn't following best practices you'll be informed on what to do to secure your environment and be in compliance.
Runecast analyzer follows VMware hardening guides in order to make the environment as secure as possible.
 In reality, you can't do all this manual way, as there are thousands of values to check and verify your environment. You need a tool for it. A Runecast analyzer for the job. It is an audit tool giving you the possibility to maintain your environment in the healthy and secure state, in compliance with VMware best practices and security hardening guides.
The fact that the tool can also receive logs, it can discover issues which are showing through those logs as well, in case the environment is running under pressure or miss optimized.

The fact that the tool can also receive logs, it can discover issues which are showing through those logs as well, in case the environment is running under pressure or miss optimized.
Runecast Analyzer features
- Configuration Analysis – the product prevents issues in your VMware vSphere environment. It can detect up to 100% of known issues. Not all 100% issues are affecting customers so it’s safe to say that Runecast Analyzer can prevent from about 90% of issues affecting customers today.
- Compliance Check with Security Hardening – a security hardening checks and best practice check can be run automatically every week, day or an hour. Posible to switch to manual only, if needed.
- Log Analysis – The system collects and maintains logs in a DB. You can configure the size of that DB. The patterns in the logs are analyzed and misconfiguration is detected, Runecast gives you a solution. The config of ESXi hosts can be triggered automatically so the logs can be sent to Runecast. You can navigate through logs via responsive graphic charts and do searches.
- Fast and Easy to Understand UI – HTML 5 based UI does not need any additional plugins to be installed in your browser. The system is fast, responsive and easy to work with.
Runecast Analyzer Installation
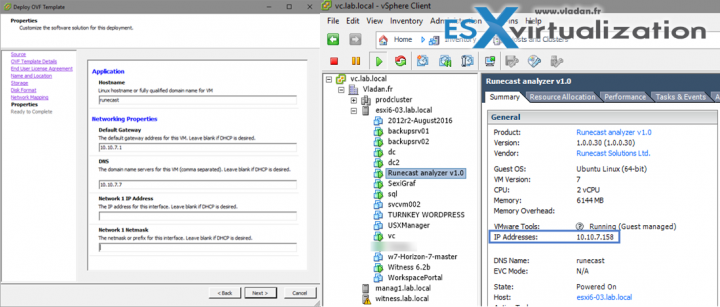
The Runecast analyzer is bundled as a virtual appliance. (OVA file). The deployment is really simple. During the deployment phase, you're asked about the usual networking information like hostname, default gateway, IP config…. And you can also change that information later, via VAMI by accessing via traditional well-known port 5480. The access url to the configuration of the appliance is https://ip_of_runecast:5480.
Username: rcadmin
Password: admin
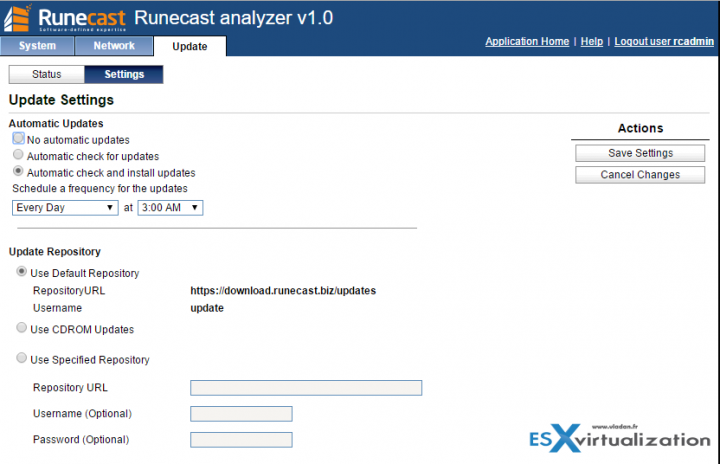
There you can not only change the IP settings but also configure the automatic updates (it's an Ubuntu Linux VM) from Runecast download repository.
The screen looks like this. Pretty standard, but personalized by Runecast…
Let's move on with the deployment. On the screenshot below you can see the traditional OVA deployment wizard window asking you about your networking details, and where you can leave blank the Network IP address and subnet mask, if you don't want fixed IP. Then pick the IP information needed for the connection to the Runecast analyzer UI, through
Then pick the IP information needed for the connection to the Runecast analyzer UI, through a vSphere client. You can be up and running under a minute…
Runecast Analyzer Configuration
 The first connection to the Runecast analyzer UI is done via web browser. Any modern browser supporting HTML5 works. So in our case, the https://10.0.7.158 as an IP address is used as a connection. This address is redirected to this one: https://10.10.7.158/rc2/login
Username: rcuser
Password: Runecast!
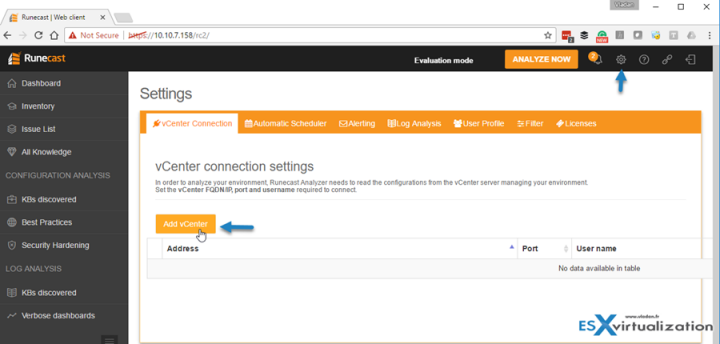
The first connection throws in a big message telling you to connect your vCenter server. Yes, this is an obligatory step. All you need to have is the IP (or FQDN) of vCenter server and the credentials. On the initial screen, you'll find a link or you can use the icon on the right top of the screen which leads to the settings page. Note that the product supports several vCenter servers.
The UI of the configuration page looks like this….
While in the configuration, you can also setup the automatic scheduler (default is manual). The scheduler allows you to schedule scans:
- Weekly – with possibility to setup day and hour
- Daily – every (1-12) day(s) at certain hour
- Hourly – Every 1-12 h scans
On the Alerting TAB, you can specify your e-mail preferences if you want the reports to be delivered by e-mail to your mailbox. Or it can be a shared mailbox for alerts for all your organization, where all admins receiving a copy. It all depends on your organization's structure and policy.
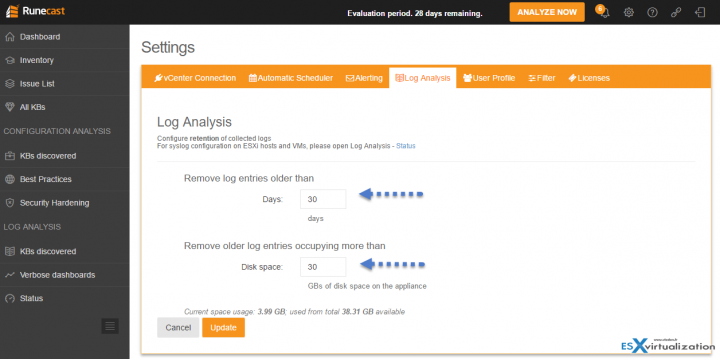
The Log Analysis tab allows to setup the size and duration of logs. The default is 30 days retention and 30 Gb of disk space. The VM is provisioned with a 40Gb thin provisioned disk so you might want to consult the manual or ask support if you'd like longer retention period or if you'd like to store more logs.
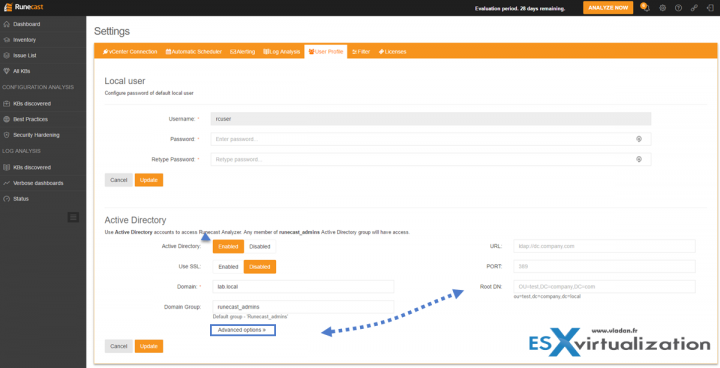
User Profile tab allows you to change the default password or to configure Active directory connection. You cannot add another local user for the solution, but by adding AD users to the “runecast_admins” which you'll create in your AD, you can give access to your team members and keep centralized management.
The User Profile tab looks like this. Note that the AD settings has an advanced option which allows to use a different port or specify a different URL or Root DN.
License configuration is the last tab. Once done, hit the Analyze Now button which will analyze quickly your environment. In my case, it took 1-2 min only as I'm running 4-5 hosts with less than 50 VMs in total.
Once the initial configuration was done, you're ready to go as the logs configuration is optional. You may also be using other solution to collect logs from your ESXi and don't want to use Runecast for that. You have a choice not to.
Runecast Analyzer Dashboard Overview
On the left-hand side, you have the main menu.
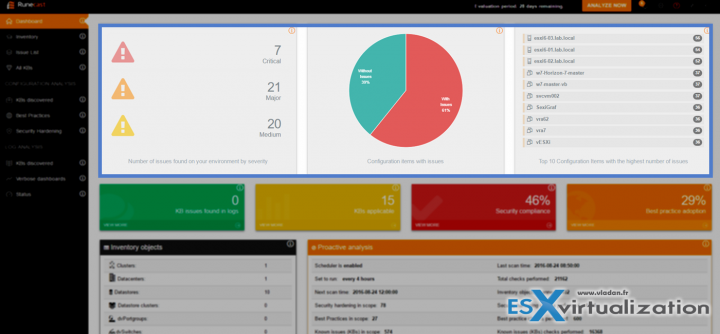
Runecast Analyzer and the overview of my lab via the Dashboard menu view.
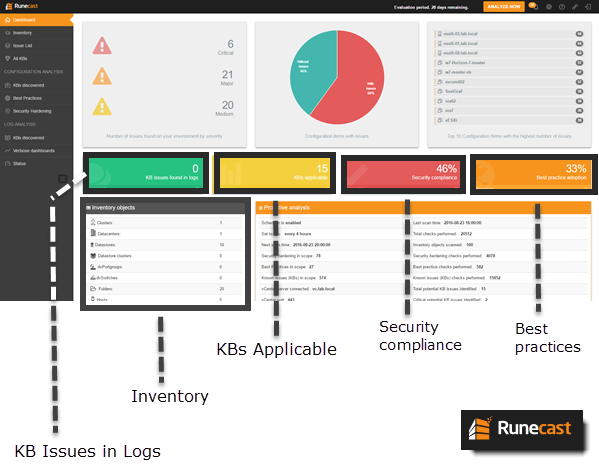
The Dashboard menu lists issues:
- By Severity
- By percentage
- Top 10 configuration items
You can click any of the areas to see the Critical, Major or Medium issues…
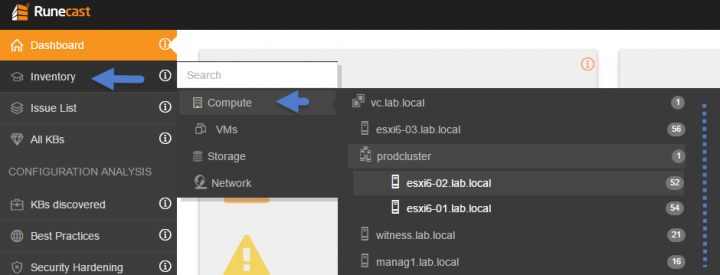
Inventory List
The inventory list allows you to check the specific object in your inventory. It can be a Compute, VM, storage, network or on the sub-menu (ex. of the compute menu)…
Before we dig in, I'd like to point out the last one menu item, at the very bottom. It's called Status and there you can setup the ESXi log settings. There you can also find VM logs settings or see the General stats of the Runecast appliance with information like:
- Log entries usage
- Total log entries
- CPU load, swap, heap
- Disk usage
Issue List Menu
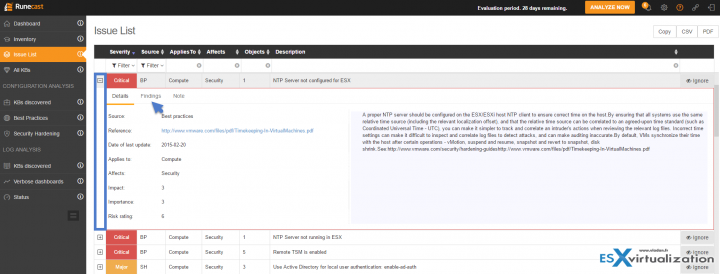
This menu shows all discovered issues based on VMware KBs and best practices and Security hardening guides from VMware. You got all three in here. If you want, you can use the separate menus for each. We're detailing it too below.
I think that I did not configure NTP on one of my hosts… Let check the Findings sub-tab to see which one of my host I omitted to do so…
Oh right, it is a VMware Witness Appliance for my VSAN ROBO cluster…
OK, I know about the issue and can easily correct that… Let's jump into the next menu.
KBs Discovered Menu
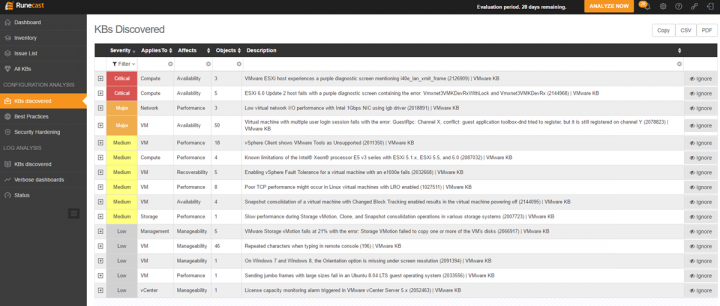
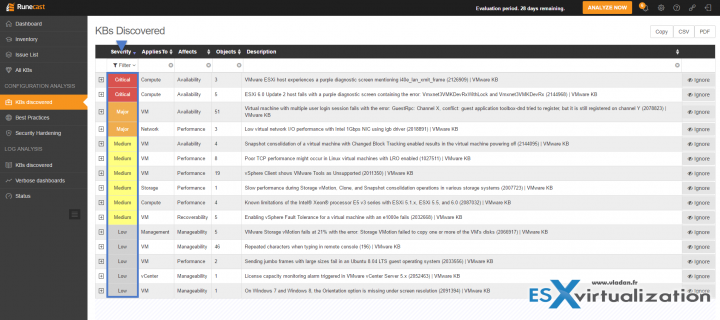
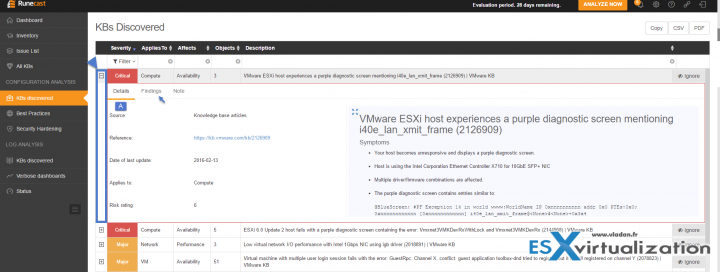
Now let's click the KBs discovered under the Configuration analysis menu. You'll find a list of KBs with issues sorted by Severity (default). You can click the other colons to sort by compute, network VM, management or vCenter. You also have the number of objects count in each row as well as a description.
By clicking the Plus sign (next to the Severity) you'll expand the KB related to your environment. As you can see you'll end up on the Details sub-tab. I put a small blue arrow to indicate the next tab which is Findings. Basically, the Details sub-tab indicates the KB and the details. A Note sub-tab allows you to annotate the issue if you like. VMware alerts me that my hardware has a well-known issue, it is critical, and that gives me a solution how to fix it….
Let's click the Findings sub-tab to see how it looks like. As you can see, my 3 hosts are having the same issue. (Note: I know about it because a VMware engineer has pointed me out to this issue a few weeks back. But only by chance as I discussed with him my network hardware details config). Imagine you're VMware admin, your hardware is on the HCL and you are not aware of such a risk. You may experience a major failure as PSODs (Purple screen of death) are problems very difficult to discover and find what's causing it…
Best Practices Menu
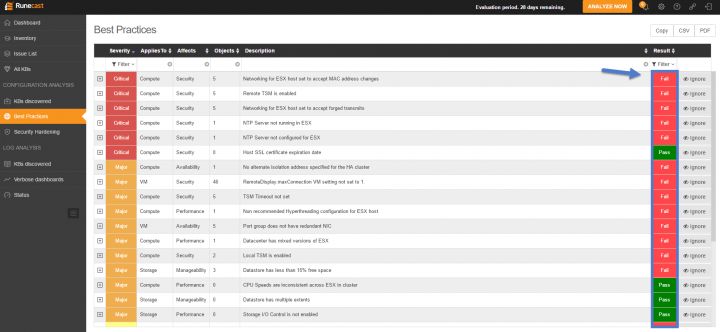
This view includes industry best practices related to VMware. Each best practice is checked against the configuration items from the scanned virtual infrastructure. The best practices are established with industry experts, VCAPs and VCDX people, and has a goal to run an infrastructure in best configuration state.
Again, by default, you have the issues sorted by severity. On the right-hand side, you can see the results. It can be Fail or Pass. If failed, you should check it out and reconfigure your settings.
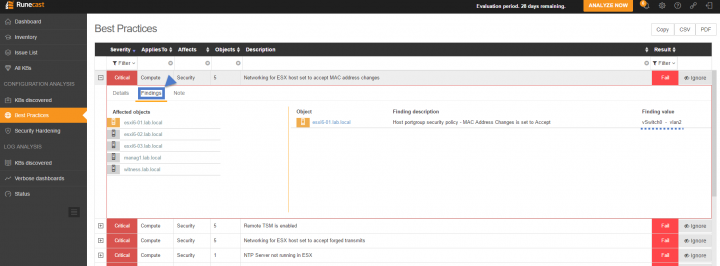
And if I want to see the details I just have to expand the issue by either clicking the “Plus” sign or by clicking on the row > and then by going to the Findings sub-menu. You can see that my first host is pre-selected and the bad config is my default vSwitch config which has a default vSphere network settings as Accepting MAC address changes. Well, in a lab environment which gets rebuilt quite often, isn't expected to have the best practices applied. That's for sure -:).
In a production environment, however, you should change it. Reject MAC Changes can be set to the virtual switch and/or the Portgroup level. You can override switch level settings at the Portgroup level.
You got now a good idea where is the value add in this product.
Security Hardening Menu
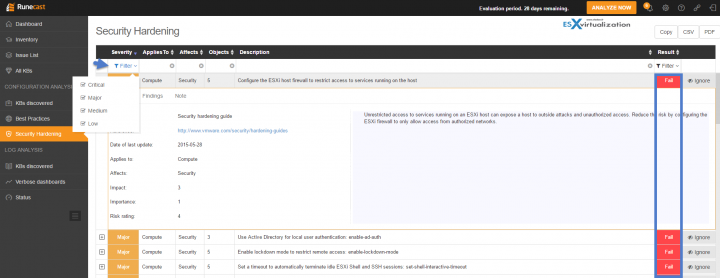
This menu applies the same system. You have a severity issues sorted by default from Critical > Major > Medium > Low. By clicking a row or the “Plus” sign you expand a particular row. On the right, you can see if you have Passed or Failed. I only have Major, medium and low. You can additionally filter and keep only Major and Critical.
On the right, there is another column called Ignore. When you click the Ignore button you can create a filter allowing you to exclude this object from future checks…. Filters can be used to disable a combination of configuration items and issues from showing in the reports and statistics. Without filters, Runecast will include all configuration items it has access to for all possible problems and best practices.
Runecast Analyzer Filter Option
Runecast Analyzer Tips
You can enable tips by clicking the question mark icon in the Right Top menu. This allows you to have question marks appear through the UI and see useful tips. Neat…
Wrap-UP
Before reviewing this product I knew a little bit about this solution, but now knowing all the possibilities, it's kind of a no-brainer as it helps you discover the secret configuration problems and risks that are currently active. The system auto-update itself to fetch the latest VMware KB articles and VMware best practices and hardening guides so it is something that you can setup and forget it. At least if you're serious about security, risk, and availability. It's a time saver which allows you to pinpoint problems faster, much faster than manual way.
By automating the checks and configuring email reporting you should be fine to maintain your environment secure without issues. Whether you manage small VMware vSphere environment, larger enterprise or service provider, you will find a value in this product.
Note that this review was sponsored by Runecast.







VMware has the Health Analyzer Tool available to partners. It looks to do the same things as this.