New Virtualization Manager from SolarWinds – product review.
Virtualization Manager enables you to manage and monitor virtual environments. You’ll see that the deployment process is easy and the user interface is nice and intuitive. Virtualization Manager helps administrators to do capacity planning where you’ll see when you need to add more hardware in your datacenter.
You can also tackle VM sprawl or performance bottlenecks (if any). Additionally, rightsizing recommendations are usefull when it comes to memory size or numbers of CPUs for different VMs. The product is installed as a virtual appliance meaning no extra physical servers are necessary to run.
I’ll show you the installation and the configuration steps that I have done in my lab, which runs latest VMware vSphere 5 U1. Please note that Virtualization Manager can manage Hyper-V environments too, and depending on your situation, you will probably choose to download the format that fits your need.
On my end, I chose the OVF format, which is a standard transport format of virtual machines. The Open Virtualization Format (OVF) is packaged as a single file with extension OVA. This single packaging when imported into vCenter can come up as a VM configuration with multiple disks, so the obvious advantage is simplicity.
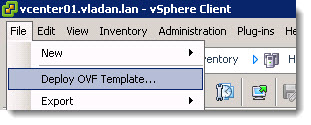
To install Virtualization Manager in a vSphere environment, first open the vSphere client and connect to your vCenter. Then choose File > Deploy OVF Template > navigate to the folder where you downloaded and uncompressed the download file. You’ll be looking for the OVA extension.
The deployment process is very easy to do. You can be up and running in less than 20 minutes.
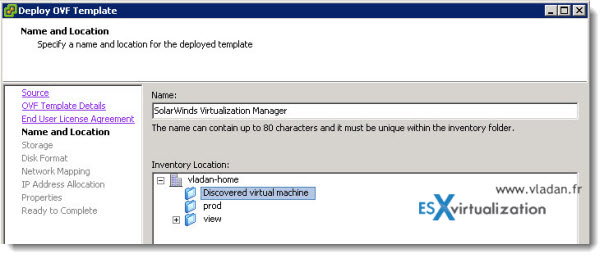
After accepting the EULA, the installer asks you for basic information, like Name and Location on where you want to install the virtual appliance.
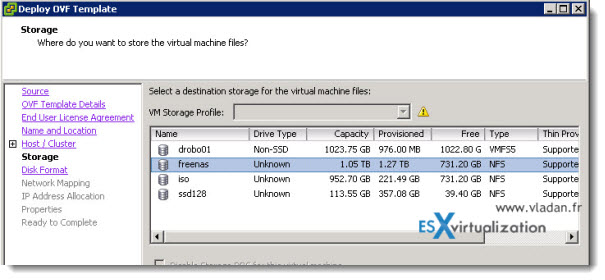
Then you can continue to specify the datastore. You’ll probably choose a shared storage (in my case, it’s my NAS box running FreeNAS, because I do not have a real SAN).
Next comes the network configuration, you’ll probably want to configure a fixed IP address for the appliance. Those are the first configuration steps before you can log in and configure the rest. What else needs to be configured?
By using your web browser and going to the IP address which you have chosen during the deployment process followed by the port 5480, you can log in (user: admin and password: admin are the default values).
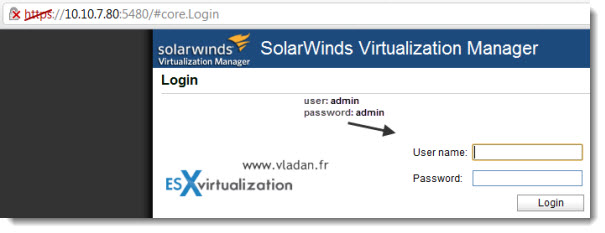
By going through this connection, you can configure/change the values.
Login: admin
Password: admin
You can also change that password in that place, view logs, re-configure your network etc……
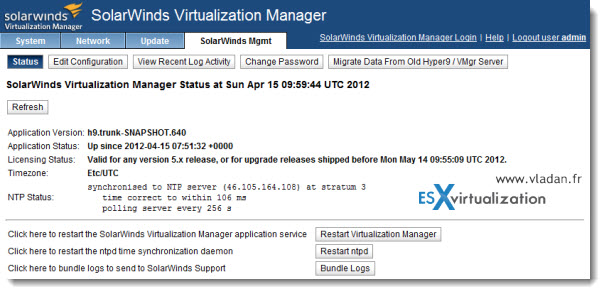
Once the basic setup is done, you can quit this browser window and log in by using the web browser. But this time you will not put the port number after the IP address.
You’ll be presented with this nice user login screen. Just to point to the quality of the product, there are hints which are accessible by clicking the question mark. In this example, when I hover and click with my mouse over the question mark next to the login screen, a simple window pops up showing the information about the login/password information…. Quite neat.

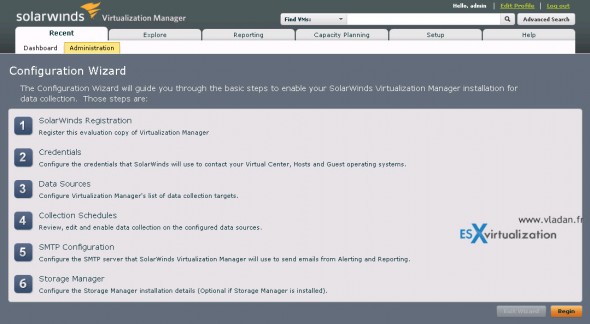
Once logged in, you will be asked to follow a configuration assistant, which needs some values, like your vCenter’s IP address etc… The configuration assistant window looks like on the screenshot below (you can click to see larger view).
Please note that the point 6 is Optional. (Storage Manager). Can be skipped.
Once done, you can start to explore the user interface. Since the beginning, I was very nicely surprised by the speed of the UI. SolarWinds guys did a good job -:)…. because when compared to some other UI running through Flash interface, this one is really fast and the navigation is very enjoyable through the menus.
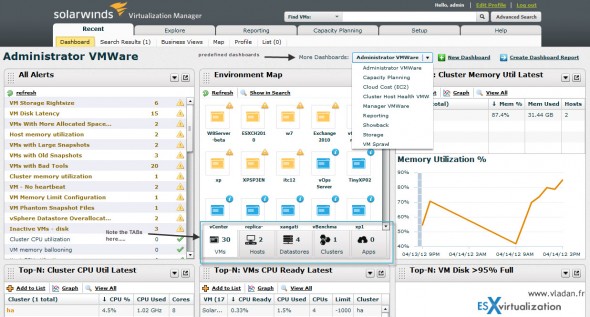
You’ll see a drop down menu with predefined dashboards there. This is the first thing I noticed immediately, and started the exploration. You choose the predefined dashboard you want.
Click on the image below to see detailed view.
As you can see, there is quite a few predefined dashboards already created. You can just choose one of them to see if it helps you on what you need to find out.
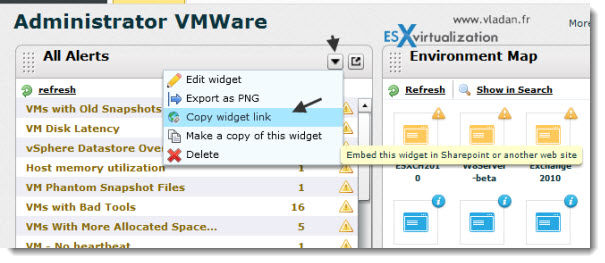
Each widget which is pinned to the dashboard has a simple menu which enables you to do actions.
In the image below you can see that Is possible to copy the widget’s link for embeding into SharePoint…
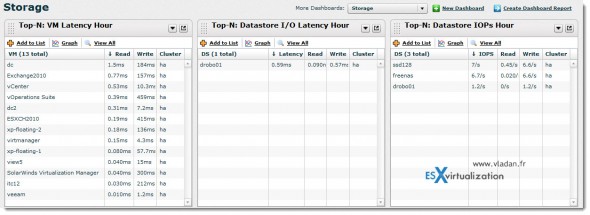
The next thing I wanted to do is have a look at the Storage dashboard. This view can help you troubleshoot the performance at the storage level. Tracking latency per VM or per datastore can be interesting, in order to find out the VM or datastore which is in trouble…
You can click to see larger view.
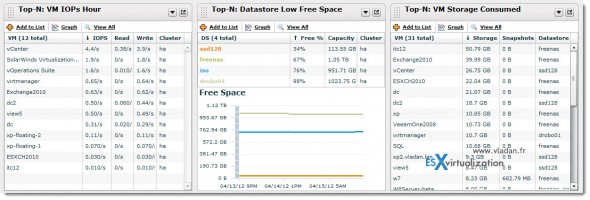
This Storage dashboard view shows you datastore IOPs and also IOPs at the VM level. You can also see the active snapshots (if any) per VM and datastore space consumed.
The reporting capabilities of the product are, it seems to me, very large and very flexible, since it’s possible to run scheduled complex reports which can be saved as PDF or XLS afterwards.
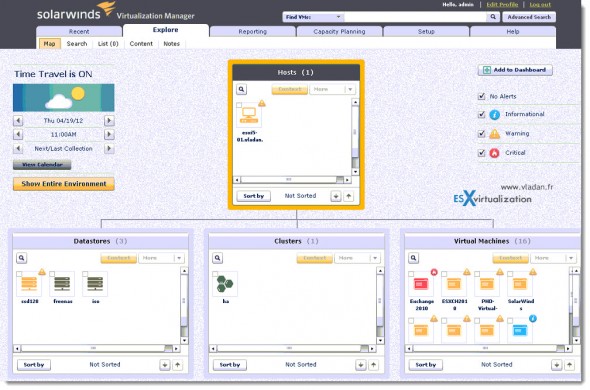
Map View – this view can be interesting to explore your virtual environment with one really cool feature which I just discovered – Time Travel. This feature can be a good help when you want to troubleshoot past performance issues for example, because you can use the calendar and go back in time to the day when you want to see what was happening on this or that ESXi or datastore.
Note that this feature is not active when you first click on the Explore TAB, but I'll show you on how to activate and what you can do with that.
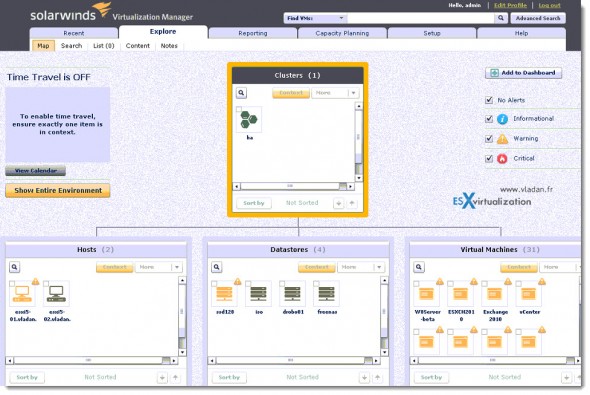
When you click on the Explore TAB on the UI, you’re presented with a map view of your complete environment. You can see your clusters (in my case HA cluster – there is only one), ESXi hosts, Datastores and VMs.
You can see the image below of the environment without Time travel active.
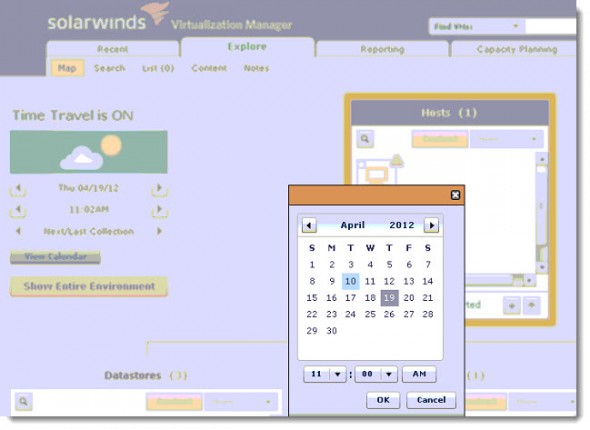
Now you can click the calendar icon, and choose the day that you want to have a look. In my case we were the 19th of April, and I chose to go back to the 14th of April.
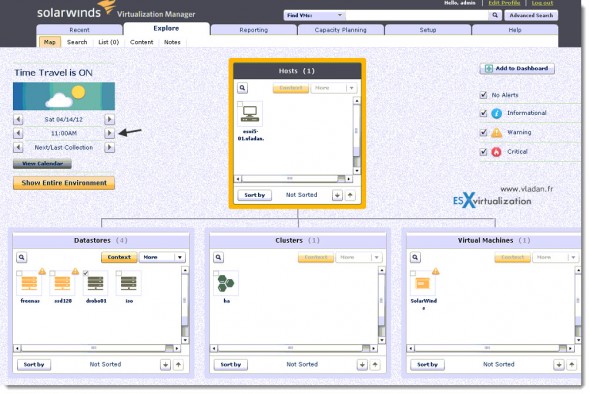
And as a result, you'll be able to see on the next image which shows you what was happening the Saturday 14th of April. You have the possibility to change hour/day back and forth and also change to the past/next collection. The interface is clear and intuitive.
I can see that the situation in my lab was really not the same, and what has changed over the last couple of days. Some vMotions operations have placed most of my VMs elsewhere since…
It’s impossible to cover every single feature and detail that the product has to offer. In my quick install/configure test in my lab, I discovered a product which felt very mature and fast in navigation and execution. Context help was intuitive and hints always at places which one would expect to have hints there.
Yes, I must say that this is a product capable to deliver what an administrator of VMware vSphere needs: Get the accurate and correct information to be able to take the right decisions. Decisions for rightsizing a CPU or Memory of a VM or storage vMotion a couple of VMs out of very busy datastore (if sDRS isn’t used of course).
Note: Please note that this review has been sponsored by SolarWinds
Learn more about SolarWinds Virtualization Manager or download a free trial.

